Unlock a world of possibilities! Login now and discover the exclusive benefits awaiting you.
- Qlik Community
- :
- Forums
- :
- Analytics
- :
- New to Qlik Analytics
- :
- Selecting 200 entries from a bar chart to make a f...
- Subscribe to RSS Feed
- Mark Topic as New
- Mark Topic as Read
- Float this Topic for Current User
- Bookmark
- Subscribe
- Mute
- Printer Friendly Page
- Mark as New
- Bookmark
- Subscribe
- Mute
- Subscribe to RSS Feed
- Permalink
- Report Inappropriate Content
Selecting 200 entries from a bar chart to make a filter
Hello all! Beginner question here!
I have created a bar chart of customer IDs (X axis) vs net sales (Y axis) and I wanted to select the top 200 customers. So from the side tab made the necessary change in the limitation setting and chose 200. 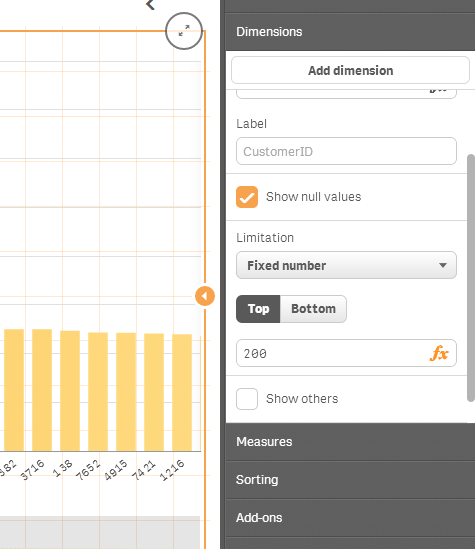
Now, my data has other properties like, zip code of the customer, mode of purchase etc. So what I want to do, is select these top 200 customers and make a filter out of that. So that I can analyse my data solely on the basis of the selected individuals.
Like for example say, I want to make a pie chart of the mode of order (as dimension) and net sales (sum net sales as measure) with the filter allowing me to display the relevant graphic on the top 200 customers and not all the the customers I have in the data set.
Any help would be amazing!
Thanks in advance!
Regards
Arka
- « Previous Replies
- Next Replies »
- Mark as New
- Bookmark
- Subscribe
- Mute
- Subscribe to RSS Feed
- Permalink
- Report Inappropriate Content
Hey,
I opened a new thread to discuss a similar matter. I have, however, an issue with Jonathan's file.
Any help would be greatly appreciated:
Using Set Analysis to filter for TOPx values
Cheers,
David
- « Previous Replies
- Next Replies »