Unlock a world of possibilities! Login now and discover the exclusive benefits awaiting you.
- Qlik Community
- :
- Forums
- :
- Analytics
- :
- Topics
- :
- Visualization and Usability
- :
- Using Set Analysis to filter for TOPx values
- Subscribe to RSS Feed
- Mark Topic as New
- Mark Topic as Read
- Float this Topic for Current User
- Bookmark
- Subscribe
- Mute
- Printer Friendly Page
- Mark as New
- Bookmark
- Subscribe
- Mute
- Subscribe to RSS Feed
- Permalink
- Report Inappropriate Content
Using Set Analysis to filter for TOPx values
Hi,
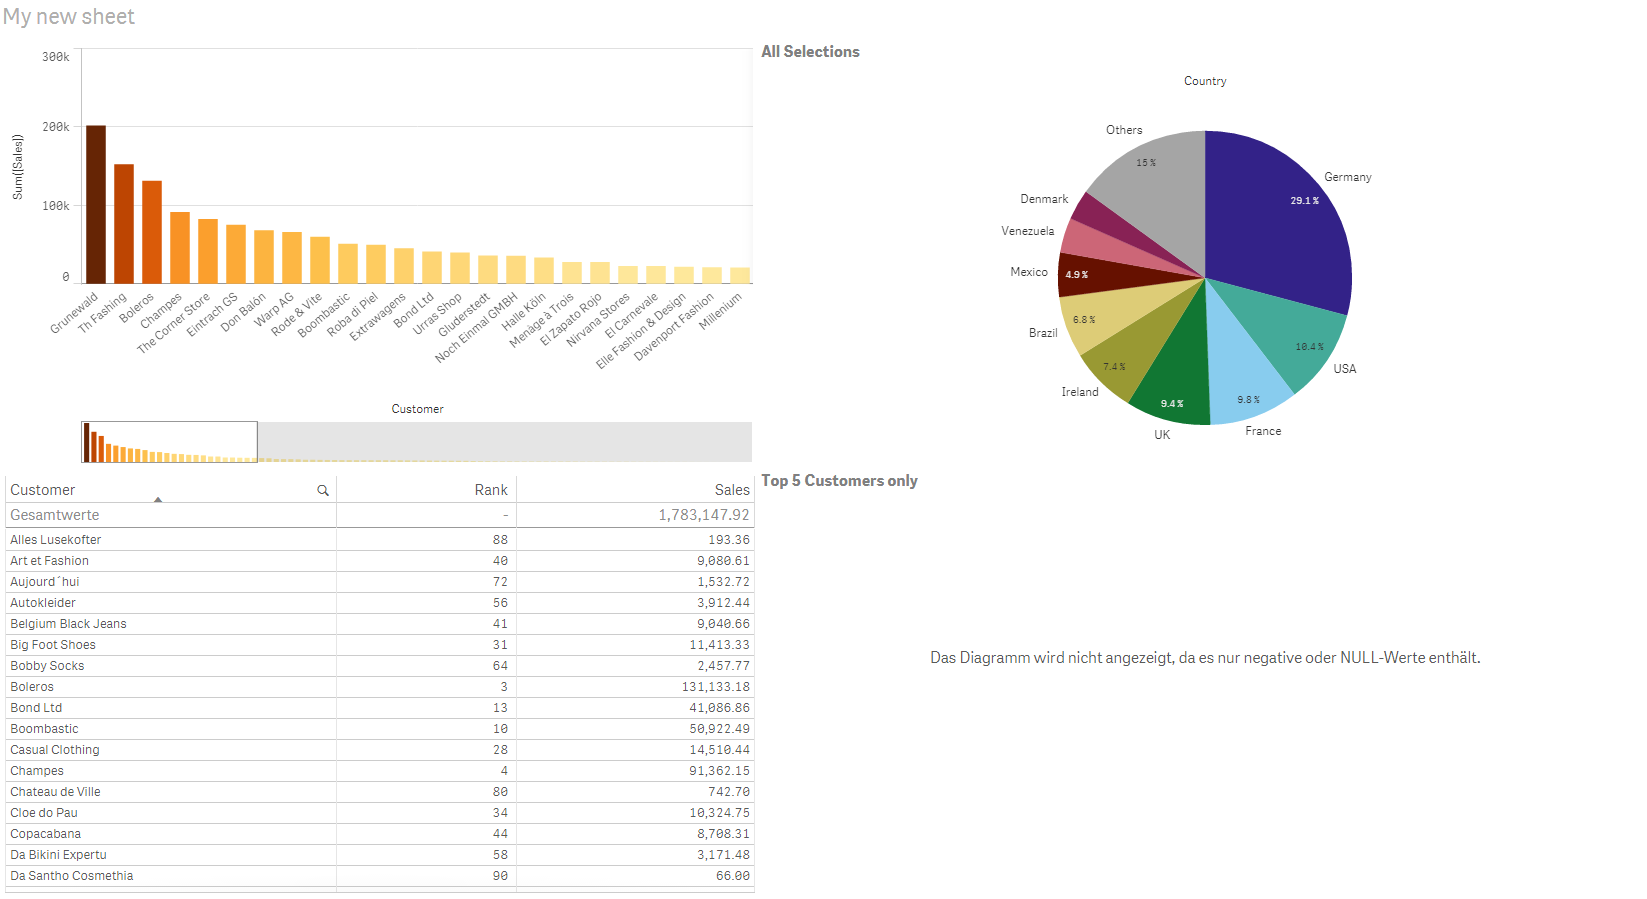
I'm trying to create a pie chart which only contains the top 5 countries by sales.
A similar problem was discussed here: Selecting 200 entries from a bar chart to make a filter
@jpe uploaded an example file in that very thread: http://community.qlik.com/servlet/JiveServlet/download/659913-138096/Lunch%20and%20Learn.qvf
However, when I ran the example, the bottom pie chart is not displayed.
The message reads "Cannot display graph because it contains only negative or NULL values".
I tried on a different platform with English UI, same error.
Using QliKSense 1.1.
Thanks for your help!
Accepted Solutions
- Mark as New
- Bookmark
- Subscribe
- Mute
- Subscribe to RSS Feed
- Permalink
- Report Inappropriate Content
If your 3rd measure was something like ' Count(CustomerID),
then you change your dimension to a calculated expression
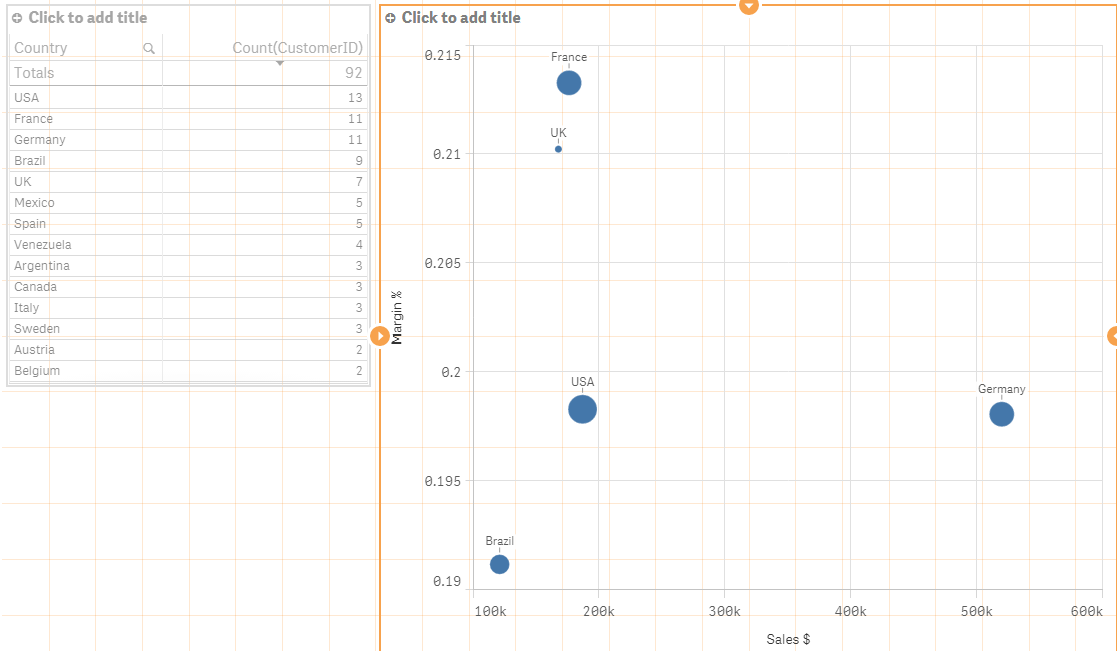
In the following example, my dimension for the scatter is country. If i change the dimension expression from Country to the following:
if( aggr(rank( total Count(CustomerID)),Country) <=5 , Country)
...and then uncheck 'show nulls' , it will only show the 5 countries with the most customers
See below for the scatter chart showing the 5 countries with most customers (bubble size) and the full list on the left.
- Mark as New
- Bookmark
- Subscribe
- Mute
- Subscribe to RSS Feed
- Permalink
- Report Inappropriate Content
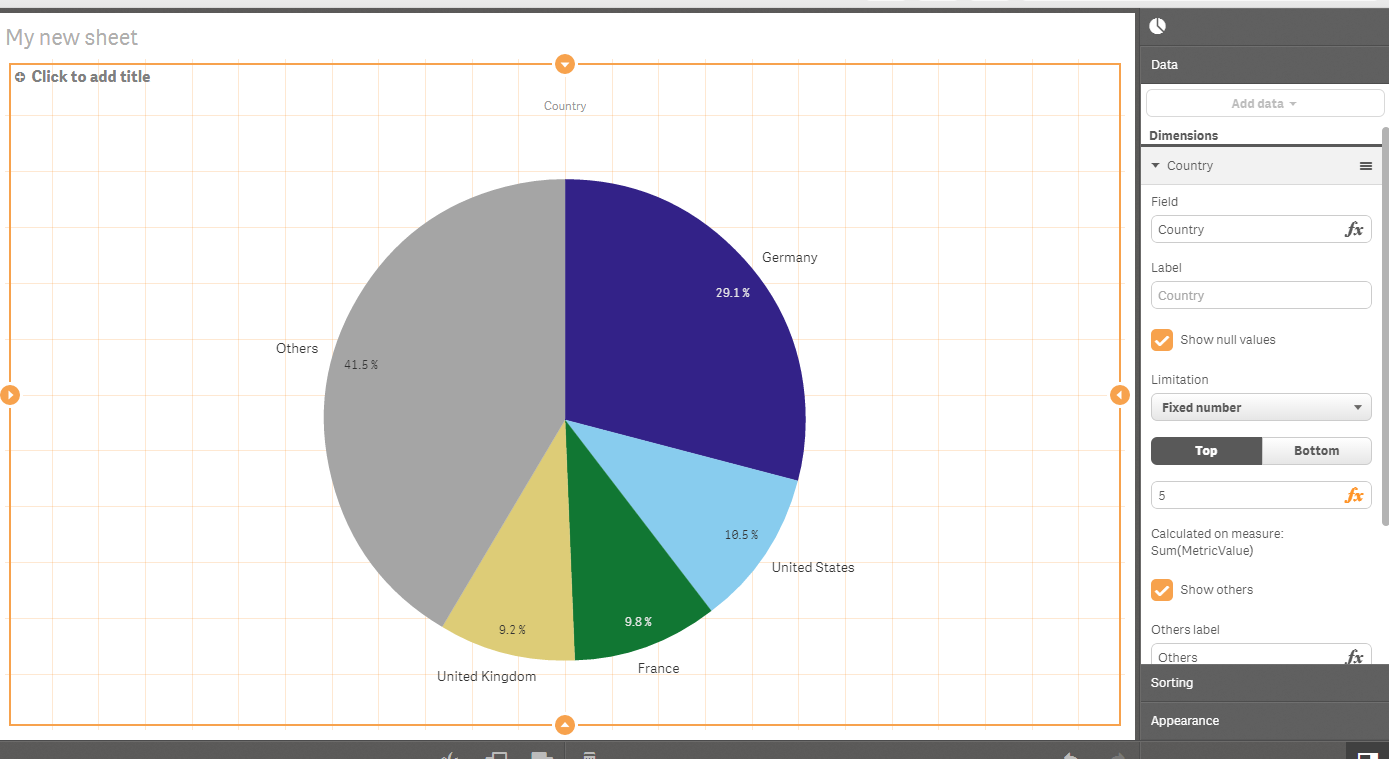
There is actually an easier way in 1.1
See below screenshot showing 'Top x' properties on right side.
- Mark as New
- Bookmark
- Subscribe
- Mute
- Subscribe to RSS Feed
- Permalink
- Report Inappropriate Content
Hi Jonathan,
thanks for your quick reply!
Unfortunately, I need the same for a scatter plot where the "Top" option is not available.
Any ideas?
- Mark as New
- Bookmark
- Subscribe
- Mute
- Subscribe to RSS Feed
- Permalink
- Report Inappropriate Content
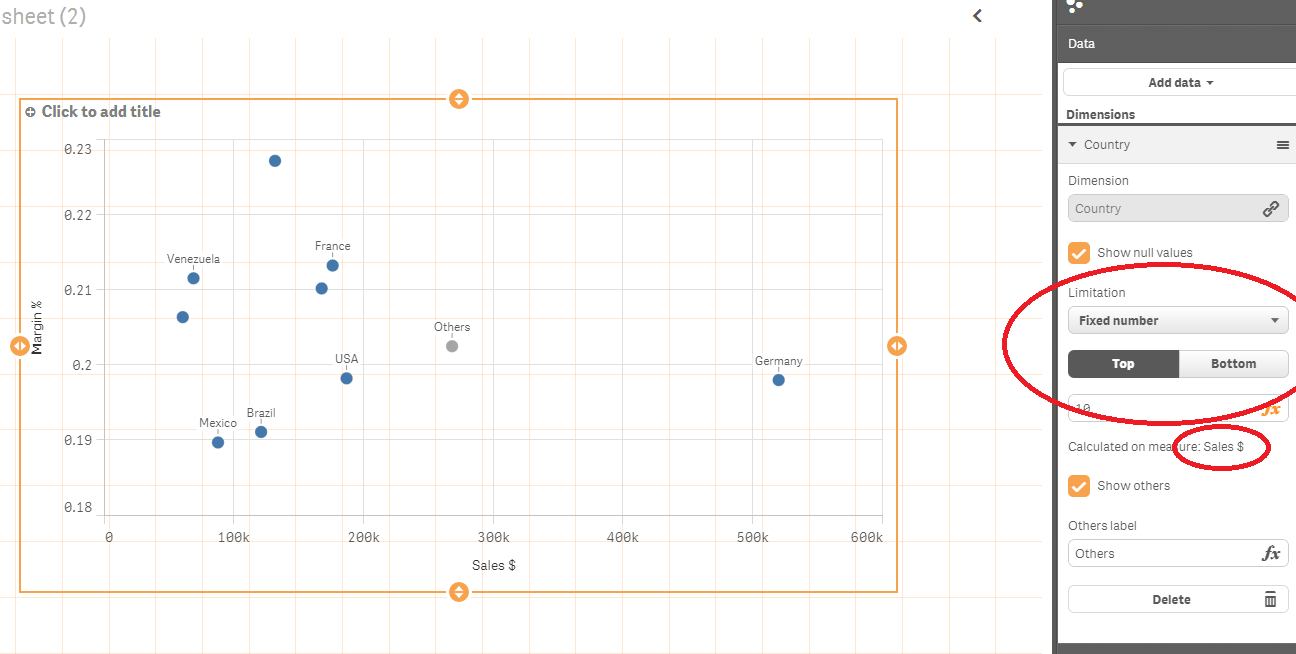
hmm.. there is that option on a scatter plot. Its done on the dimension and pertains to the 1st measure.
Would that work ?
- Mark as New
- Bookmark
- Subscribe
- Mute
- Subscribe to RSS Feed
- Permalink
- Report Inappropriate Content
worked, thank you!
- Mark as New
- Bookmark
- Subscribe
- Mute
- Subscribe to RSS Feed
- Permalink
- Report Inappropriate Content
Hi Jonathan,
just realised it only works for the first of the three dimensions. A filter for the top 1000 entries for, let's say' the third (bubble size) dimension is not possible.
Could you think of a workaround?
- Mark as New
- Bookmark
- Subscribe
- Mute
- Subscribe to RSS Feed
- Permalink
- Report Inappropriate Content
If your 3rd measure was something like ' Count(CustomerID),
then you change your dimension to a calculated expression
In the following example, my dimension for the scatter is country. If i change the dimension expression from Country to the following:
if( aggr(rank( total Count(CustomerID)),Country) <=5 , Country)
...and then uncheck 'show nulls' , it will only show the 5 countries with the most customers
See below for the scatter chart showing the 5 countries with most customers (bubble size) and the full list on the left.
- Mark as New
- Bookmark
- Subscribe
- Mute
- Subscribe to RSS Feed
- Permalink
- Report Inappropriate Content
that's the one! Thank you very much!
Didn't think of manipulating the dimension rather than the measures. Now it seems rather obvious 