Unlock a world of possibilities! Login now and discover the exclusive benefits awaiting you.
- Qlik Community
- :
- Forums
- :
- Analytics
- :
- New to Qlik Analytics
- :
- Sense Limitations - Number of points in a scatter ...
- Subscribe to RSS Feed
- Mark Topic as New
- Mark Topic as Read
- Float this Topic for Current User
- Bookmark
- Subscribe
- Mute
- Printer Friendly Page
- Mark as New
- Bookmark
- Subscribe
- Mute
- Subscribe to RSS Feed
- Permalink
- Report Inappropriate Content
Sense Limitations - Number of points in a scatter plot
Hi,
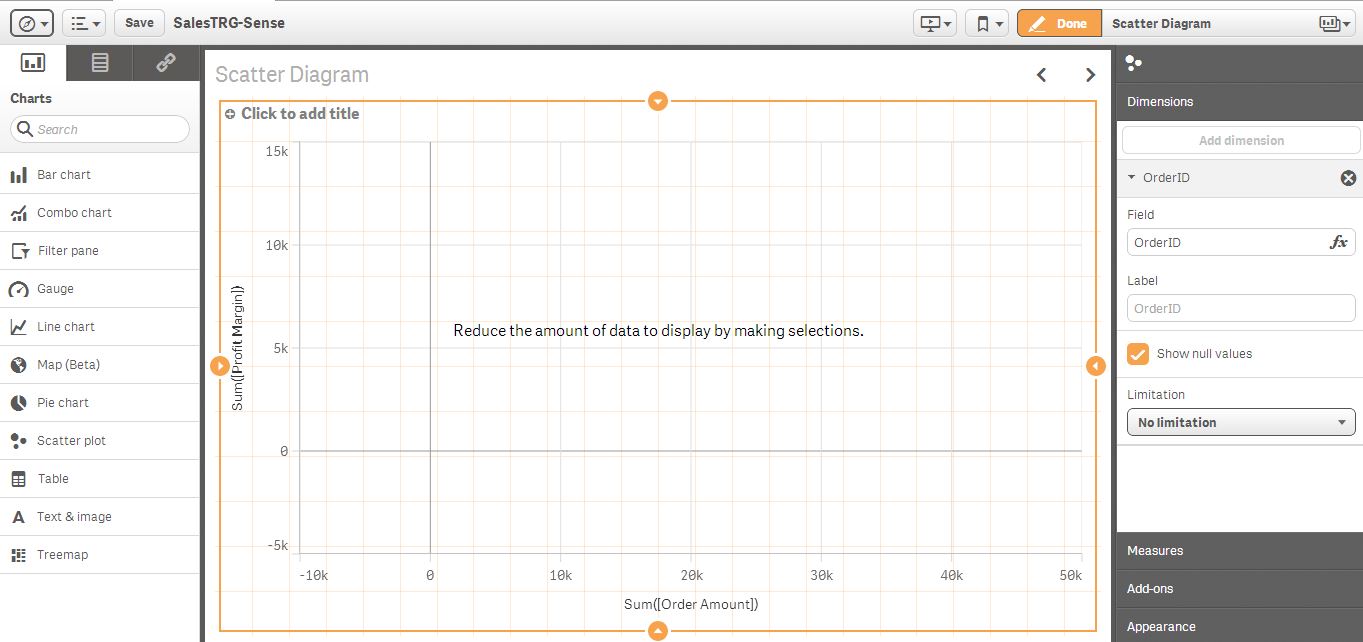
I note that Qlik Sense does not allow more than a 1000 points to be plotted on a Scatter Plot. And it does not seem to be accepting a second dimension in a scatter plot.
Below is the error message that I first got when I tried the scatter plot:

I could get the plot after I used "Limitation" option, restricting it to Top 1000 values (1001 raises an error)

Is this a Qlik Sense limitation? If yes, then 1000 data points are inadequate.
And I no longer see the second dimension as an option for scatter plot.
Gopinath
Accepted Solutions
- Mark as New
- Bookmark
- Subscribe
- Mute
- Subscribe to RSS Feed
- Permalink
- Report Inappropriate Content
Hi,
This is a known issue we are working on. Stay tuned for updates.
Miguel
- Mark as New
- Bookmark
- Subscribe
- Mute
- Subscribe to RSS Feed
- Permalink
- Report Inappropriate Content
Hi,
This is a known issue we are working on. Stay tuned for updates.
Miguel
- Mark as New
- Bookmark
- Subscribe
- Mute
- Subscribe to RSS Feed
- Permalink
- Report Inappropriate Content
Hi Miguel,
I have also reached this point. I have need to show 4500 data points on a scatter plot to show a trend. Using 1.0.2 I get the "Reduce" message, however this is the visual I'm hoping to show in QlikSense:
I've tried to create a D3 scatter chart and up the limit to 5000 but I get a red stripped container with simply the message: 'Error Unknown Error' and I can't find anything in the debugging console.
I can download the data correctly, however. Is there some hidden limit?
Kind Regards,
Dave
- Mark as New
- Bookmark
- Subscribe
- Mute
- Subscribe to RSS Feed
- Permalink
- Report Inappropriate Content
Hi Miguel,
I'm trying to map certain sales data with coordinates. It looks like even after i set the "Colors and legend" to "by measure", the color dot doesn't reflected to the amount of sales. Is this problem link to the same problem as above?
- Mark as New
- Bookmark
- Subscribe
- Mute
- Subscribe to RSS Feed
- Permalink
- Report Inappropriate Content
I have similar issues with number of points limitations in charts. 1000 is way small, so I started using the Distribution Plot, but unfortunately it also has a limitation (3000 points). I posted my exchange of emails with Qlik in this post: