Unlock a world of possibilities! Login now and discover the exclusive benefits awaiting you.
- Qlik Community
- :
- Forums
- :
- Analytics
- :
- New to Qlik Analytics
- :
- Sense debugging options
- Subscribe to RSS Feed
- Mark Topic as New
- Mark Topic as Read
- Float this Topic for Current User
- Bookmark
- Subscribe
- Mute
- Printer Friendly Page
- Mark as New
- Bookmark
- Subscribe
- Mute
- Subscribe to RSS Feed
- Permalink
- Report Inappropriate Content
Sense debugging options
Hi everyone,
When developing general JavaScript code, a developer has access to a wealth of developer tools, particularly in browsers such as Chrome and Firefox, with great support for viewing the stack trace, watches and stepping through code.
When developing an extension, and testing in Sense, it seems to me that the only option available is an alert call, which isn't exactly ideal.
If something is amiss, an extension will fail to load, or something will not be displayed correctly.
Are there any other options when debugging code? I've spent a lot of time today 'banging my head on the desk' when things haven't gone as expected.
Thank you.
Accepted Solutions
- Mark as New
- Bookmark
- Subscribe
- Mute
- Subscribe to RSS Feed
- Permalink
- Report Inappropriate Content
Hi Shane,
The good news is that all of those same tools are actually available. You can view the Hub (and thus all of the apps) of Sense in a browser window by going to http://localhost:4848/hub
Once in the app, you could use whatever tools you normally would, like the developers console in chrome.
Also, if you want to stay in the desktop edition, there's a little easter egg where you can hold down ctrl+shift and then right click on the sheet. You'll see this menu come up:
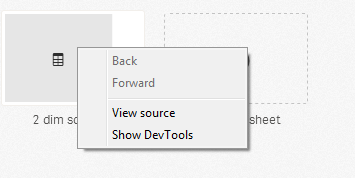
If you click on "Show DevTools" you'll see the Chrome Console (I think) appear in a separate tab.
- Mark as New
- Bookmark
- Subscribe
- Mute
- Subscribe to RSS Feed
- Permalink
- Report Inappropriate Content
Hello Shane - I sent your question to one of our resident extension experts. You should expect a response from him soon.
Regards,
Mike
Mike Tarallo
Qlik
- Mark as New
- Bookmark
- Subscribe
- Mute
- Subscribe to RSS Feed
- Permalink
- Report Inappropriate Content
Hi Shane,
The good news is that all of those same tools are actually available. You can view the Hub (and thus all of the apps) of Sense in a browser window by going to http://localhost:4848/hub
Once in the app, you could use whatever tools you normally would, like the developers console in chrome.
Also, if you want to stay in the desktop edition, there's a little easter egg where you can hold down ctrl+shift and then right click on the sheet. You'll see this menu come up:
If you click on "Show DevTools" you'll see the Chrome Console (I think) appear in a separate tab.
- Mark as New
- Bookmark
- Subscribe
- Mute
- Subscribe to RSS Feed
- Permalink
- Report Inappropriate Content
Hi Brian/Michael,
thanks very much for getting back to me. Brian - that's a great help!
Shane.
- Mark as New
- Bookmark
- Subscribe
- Mute
- Subscribe to RSS Feed
- Permalink
- Report Inappropriate Content
Hi Shane,
you can also use Ctrl-Shift-RightClick in Qlik Sense Desktop directly to open the Chrome Dev Tools.
- Ralf
- Mark as New
- Bookmark
- Subscribe
- Mute
- Subscribe to RSS Feed
- Permalink
- Report Inappropriate Content
Brian, many thanks for clarifying.
Another question in the debugging stream: how to reload the extension whose code I have updated?
- Mark as New
- Bookmark
- Subscribe
- Mute
- Subscribe to RSS Feed
- Permalink
- Report Inappropriate Content
A CTRL + F5 normally does the trick.
- Mark as New
- Bookmark
- Subscribe
- Mute
- Subscribe to RSS Feed
- Permalink
- Report Inappropriate Content
Btw F5 worked as well 