Unlock a world of possibilities! Login now and discover the exclusive benefits awaiting you.
- Qlik Community
- :
- Forums
- :
- Analytics
- :
- New to Qlik Analytics
- :
- Re: Set Analysis Quick Question
- Subscribe to RSS Feed
- Mark Topic as New
- Mark Topic as Read
- Float this Topic for Current User
- Bookmark
- Subscribe
- Mute
- Printer Friendly Page
- Mark as New
- Bookmark
- Subscribe
- Mute
- Subscribe to RSS Feed
- Permalink
- Report Inappropriate Content
Set Analysis Quick Question
Hi I am new to Qlik and have a quick question about set analysis.
The below arrangement is what I am trying to display using my data: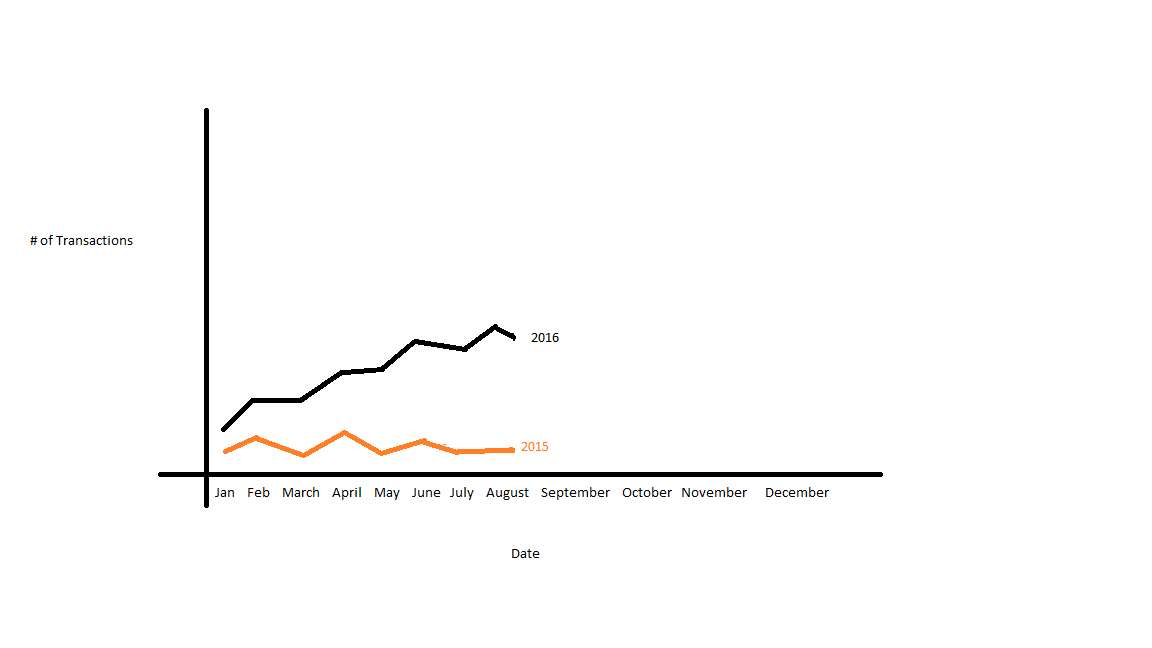
So I want to show a particular measure for year to date on a line graph and compare it with the same date last year. Displaying this on one graph is what I am struggling with.
Help is much appreciated.
Thanks
- Mark as New
- Bookmark
- Subscribe
- Mute
- Subscribe to RSS Feed
- Permalink
- Report Inappropriate Content
Without knowing your data you could simply add Set Analysis to the expression where you only Sum or Count when the Year field = '2015' or whatever year you are looking for.
Count ({<Year={'2015'}>} Amount)
Do the same thing for the other line with a different year value.
Of course this means the values are hard coded and you would have to change them for other years.
- Mark as New
- Bookmark
- Subscribe
- Mute
- Subscribe to RSS Feed
- Permalink
- Report Inappropriate Content
Hi Dauseef,
Please see this post around YTD values: QlikView App: Simple Year To Date Example (Set Analysis)
Thanks
Charlie