Unlock a world of possibilities! Login now and discover the exclusive benefits awaiting you.
- Qlik Community
- :
- Forums
- :
- Analytics
- :
- New to Qlik Analytics
- :
- Re: Show Top 5 Dimensions Based on Dimension Value...
- Subscribe to RSS Feed
- Mark Topic as New
- Mark Topic as Read
- Float this Topic for Current User
- Bookmark
- Subscribe
- Mute
- Printer Friendly Page
- Mark as New
- Bookmark
- Subscribe
- Mute
- Subscribe to RSS Feed
- Permalink
- Report Inappropriate Content
Show Top 5 Dimensions Based on Dimension Values
I have a bar graph in Qlik Sense that is showing the number of sales by year. I only want to show the top 5 years and group the remaining ones into an Other category but when I use the limitation feature it is showing the top 5 based on the measure, Sales. Is there a way to show the current 5 years (2018 through 2014)?
Accepted Solutions
- Mark as New
- Bookmark
- Subscribe
- Mute
- Subscribe to RSS Feed
- Permalink
- Report Inappropriate Content
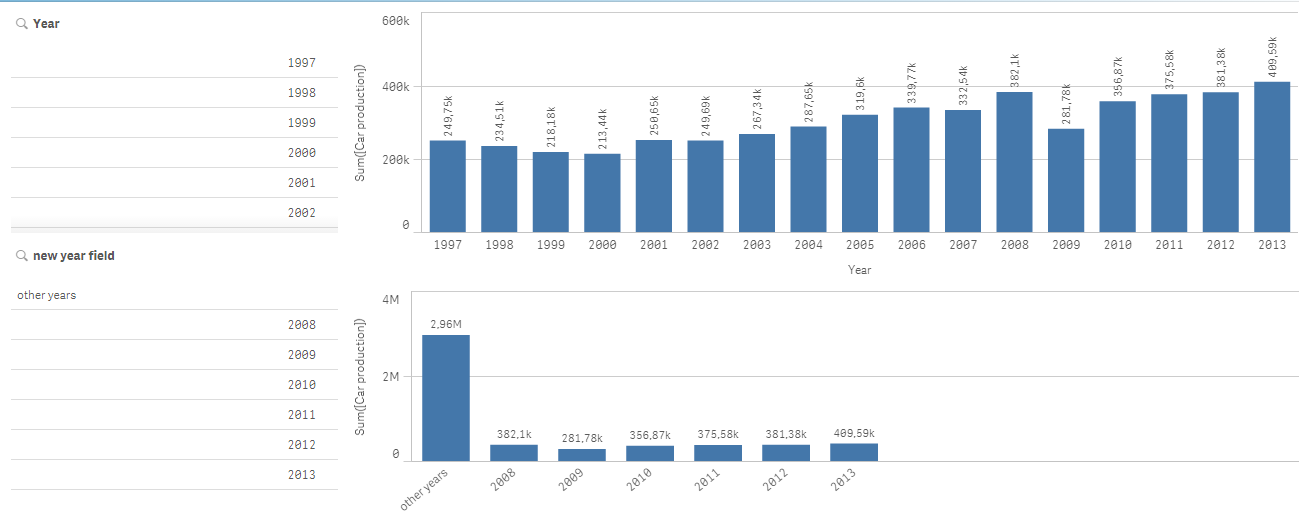
Create a master dimension as follow:
=if(YearField >= aggr(Max(all YearField ),YearField )-5, YearField , 'other years')
result:
- Mark as New
- Bookmark
- Subscribe
- Mute
- Subscribe to RSS Feed
- Permalink
- Report Inappropriate Content
Not sure but try use set-analysis in Dimension with required Years
- Mark as New
- Bookmark
- Subscribe
- Mute
- Subscribe to RSS Feed
- Permalink
- Report Inappropriate Content
Create a master dimension as follow:
=if(YearField >= aggr(Max(all YearField ),YearField )-5, YearField , 'other years')
result:
- Mark as New
- Bookmark
- Subscribe
- Mute
- Subscribe to RSS Feed
- Permalink
- Report Inappropriate Content
Thanks! This worked.