Unlock a world of possibilities! Login now and discover the exclusive benefits awaiting you.
- Qlik Community
- :
- Forums
- :
- Analytics
- :
- New to Qlik Analytics
- :
- Re: Show clients with more than 5 houses
- Subscribe to RSS Feed
- Mark Topic as New
- Mark Topic as Read
- Float this Topic for Current User
- Bookmark
- Subscribe
- Mute
- Printer Friendly Page
- Mark as New
- Bookmark
- Subscribe
- Mute
- Subscribe to RSS Feed
- Permalink
- Report Inappropriate Content
Show clients with more than 5 houses
Hi
I need to show the clients that have more than 5 houses in a table.
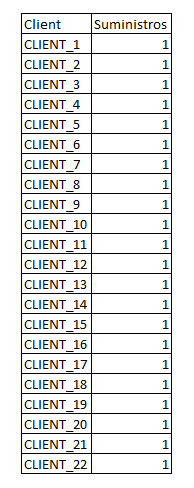
In my data I have 2000 clients but only 22 have more than 5 houses, those 22 I need to show in a table.
In the dimension I have the following expression
=if( aggr((count(NAME_CLIENT)),NAME_CLIENT)>5, NAME_CLIENT,)
Expression measure
=Sum(Aggr(if(count(NAME_CLIENT) > 5, 1, 0), NAME_CLIENT))
- Tags:
- table without expr
Accepted Solutions
- Mark as New
- Bookmark
- Subscribe
- Mute
- Subscribe to RSS Feed
- Permalink
- Report Inappropriate Content
May be this
Count({<NAME_CLIENT = {"=Count(NAME_CLIENT) > 5"}>} NAME_CLIENT)
- Mark as New
- Bookmark
- Subscribe
- Mute
- Subscribe to RSS Feed
- Permalink
- Report Inappropriate Content
If you already restrict in dimension, Why you are trying same in expression? Try this using same dimension as yours
=Sum(NAME_CLIENT)
Or
Sum(Aggr(If(Match(Count({<NAME_CLIENT = {"=Count(NAME_CLIENT)>5"}>} NAME_CLIENT),1),NAME_CLIENT),NAME_CLIENT))
My Bad, This?
=Sum(Aggr(if(count(NAME_CLIENT) > 5, 1), NAME_CLIENT))
- Mark as New
- Bookmark
- Subscribe
- Mute
- Subscribe to RSS Feed
- Permalink
- Report Inappropriate Content
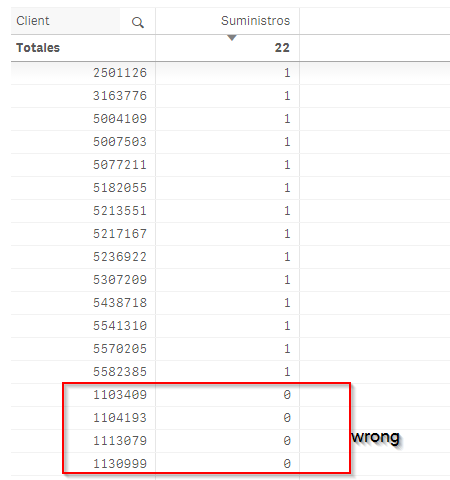
If you want to suppress the zero values,
Go to table -> Add-ons Properties -> uncheck Include zero values.
It will eliminate Zero rows in the table.
- Mark as New
- Bookmark
- Subscribe
- Mute
- Subscribe to RSS Feed
- Permalink
- Report Inappropriate Content
Why don't you try this
Dimension
NAME_CLIENT
Expression
Count(DISTINCT {<NAME_CLIENT = {"=Count(NAME_CLIENT) > 5"}>} NAME_CLIENT)
and now uncheck 'Include Zero Values' under Add-Ons -> Data Handling
- Mark as New
- Bookmark
- Subscribe
- Mute
- Subscribe to RSS Feed
- Permalink
- Report Inappropriate Content
Now it shows me the 22 clients but it does not group how many houses each client has. How do I do that?
- Mark as New
- Bookmark
- Subscribe
- Mute
- Subscribe to RSS Feed
- Permalink
- Report Inappropriate Content
May be this
Count({<NAME_CLIENT = {"=Count(NAME_CLIENT) > 5"}>} NAME_CLIENT)
- Mark as New
- Bookmark
- Subscribe
- Mute
- Subscribe to RSS Feed
- Permalink
- Report Inappropriate Content
Thanks Sunny.