Unlock a world of possibilities! Login now and discover the exclusive benefits awaiting you.
- Qlik Community
- :
- Forums
- :
- Analytics
- :
- New to Qlik Analytics
- :
- Re: Show last 28 days on bar chart
- Subscribe to RSS Feed
- Mark Topic as New
- Mark Topic as Read
- Float this Topic for Current User
- Bookmark
- Subscribe
- Mute
- Printer Friendly Page
- Mark as New
- Bookmark
- Subscribe
- Mute
- Subscribe to RSS Feed
- Permalink
- Report Inappropriate Content
Show last 28 days on bar chart
Qlik Sense question: I've searched several forums and spent hours trying to figure this out but I'm stuck. I have a bar chart that I want to show the last 28 days of 1 data point only. I've tried the following and they are not working. Qlik says "OK" to the formula but the chart is still showing more than 28 days. Any other thoughts? I'm not familiar with scripts to trying to do this using set analysis. The Excel file is simple - Column A is Date, Column B is Instock %. Thoughts?
| =Date(today()-28, 'MM-DD-YYYY') |
| =If(Date((today()-28 and Date(today()))), Date,) |
| =IF((Date >(today() AND Date(today()-28 ))), Date,'') |
- « Previous Replies
-
- 1
- 2
- Next Replies »
Accepted Solutions
- Mark as New
- Bookmark
- Subscribe
- Mute
- Subscribe to RSS Feed
- Permalink
- Report Inappropriate Content
hi @RyanP
Sorry, i made a mistake in the formula
sum({<Date={">=$(=date(today()-28))<=$(=today())"} >}Sales)
Remember to use this formula as expression
and as dimension only the date field.
it should shows as dimension the las 28 days whiout using an IF in the dimension.
Best,
- Mark as New
- Bookmark
- Subscribe
- Mute
- Subscribe to RSS Feed
- Permalink
- Report Inappropriate Content
Sorry the delay. I'm fairly new to Qlik so I had to research expressions as dimensions. I did do that and now it's working perfectly! I appreciate the help!
- Mark as New
- Bookmark
- Subscribe
- Mute
- Subscribe to RSS Feed
- Permalink
- Report Inappropriate Content
The best approach is to create a master calendar with the flags you need then use it in set analysis.
Here the best solution available: BETTER CALENDAR SCRIPTS
If a post helps to resolve your issue, please accept it as a Solution.
- Mark as New
- Bookmark
- Subscribe
- Mute
- Subscribe to RSS Feed
- Permalink
- Report Inappropriate Content
Sorry, this is over my head. Is there not an expression that I can do?
- Mark as New
- Bookmark
- Subscribe
- Mute
- Subscribe to RSS Feed
- Permalink
- Report Inappropriate Content
The master calendar is the best way, but for sure there is the possibility to write a set analysis to obtain the same result, so something like this:
sum({<Date={">=$(=Today()-28)"}>}Sales)If a post helps to resolve your issue, please accept it as a Solution.
- Mark as New
- Bookmark
- Subscribe
- Mute
- Subscribe to RSS Feed
- Permalink
- Report Inappropriate Content
Unfortunately it didn't work. I don't need to Sum anything - the data is already summed. Any other thoughts? Are any of my expressions at the top close and just need tweaked?

- Mark as New
- Bookmark
- Subscribe
- Mute
- Subscribe to RSS Feed
- Permalink
- Report Inappropriate Content
So please share the dataset and an example of what you want to obtain.
If a post helps to resolve your issue, please accept it as a Solution.
- Mark as New
- Bookmark
- Subscribe
- Mute
- Subscribe to RSS Feed
- Permalink
- Report Inappropriate Content
Excel file has 2 columns that I upload in Data Manager (see below) but I have 60 data points - I want to show the last 28 days on a bar chart. The bar chart isn't the issue - it's trying to display the last 28 days is what I'm trying to achieve. For example, I want to show the instock for 9/30, 9/29, 9/28, etc (back to 28 days). Does that help?
Date Instock
9/20 98%
9/21 97%
9/22 96%
- Mark as New
- Bookmark
- Subscribe
- Mute
- Subscribe to RSS Feed
- Permalink
- Report Inappropriate Content
Here the script i used to generate the dataset:
load
Date(Date#(Date,'MM/DD/YYYY'),'MM/DD/YYYY') as Date,
Instock
Inline [
Date,Instock
09/01/2022,0.91
09/02/2022,0.94
09/03/2022,0.95
09/04/2022,0.97
09/05/2022,0.92
09/06/2022,0.91
09/07/2022,0.99
09/08/2022,0.98
09/09/2022,0.94
09/10/2022,0.93
09/11/2022,0.98
09/12/2022,0.96
09/13/2022,0.97
09/14/2022,0.98
09/15/2022,0.93
09/16/2022,0.92
09/17/2022,0.93
09/18/2022,0.88
09/19/2022,0.89
09/20/2022,0.91
09/21/2022,0.94
09/22/2022,0.99
09/23/2022,0.97
09/24/2022,0.96
09/25/2022,0.94
09/26/2022,0.96
09/27/2022,0.98
09/28/2022,0.99
09/29/2022,0.93
09/30/2022,0.94
10/01/2022,0.95
];
here the expression:
Only({<Date={">=$(=date(Today()-28,'MM/DD/YYYY'))"}>}Instock)and the result:

If a post helps to resolve your issue, please accept it as a Solution.
- Mark as New
- Bookmark
- Subscribe
- Mute
- Subscribe to RSS Feed
- Permalink
- Report Inappropriate Content
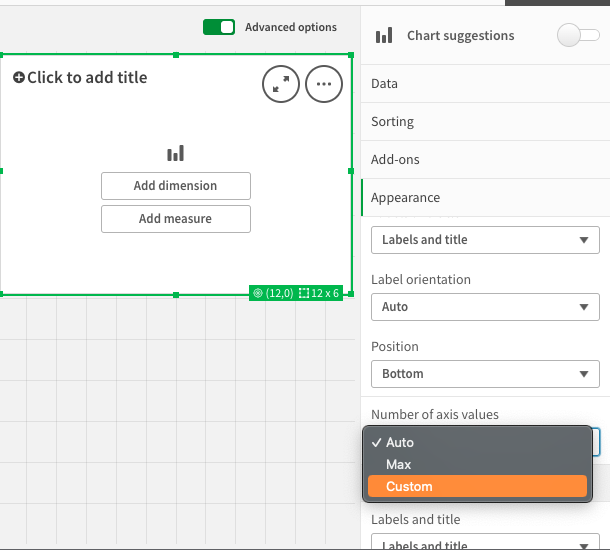
Maybe this could work as well, sort your data by descending order in the date column and use the max axis value option to show only last 28 values.

This is short cut way, best way is to use a master calendar with flagging in the backend.
- Mark as New
- Bookmark
- Subscribe
- Mute
- Subscribe to RSS Feed
- Permalink
- Report Inappropriate Content
Hi @RyanP
you can try
if you are going to use "Date" as dimension, dont use the provided "=IF ...." just use the field
and as expression you can use the following:
sum({<Date={">=$(=today()-28)"}<=$(=today()) >}Sales)
Best,
- « Previous Replies
-
- 1
- 2
- Next Replies »