Unlock a world of possibilities! Login now and discover the exclusive benefits awaiting you.
- Qlik Community
- :
- Forums
- :
- Analytics
- :
- Topics
- :
- Visualization and Usability
- :
- Show negative values on Pie Chart
- Subscribe to RSS Feed
- Mark Topic as New
- Mark Topic as Read
- Float this Topic for Current User
- Bookmark
- Subscribe
- Mute
- Printer Friendly Page
- Mark as New
- Bookmark
- Subscribe
- Mute
- Subscribe to RSS Feed
- Permalink
- Report Inappropriate Content
Show negative values on Pie Chart
Hi,
I have a problem where whenever negative values are included in a pie chart, they are ignored Qliksense.
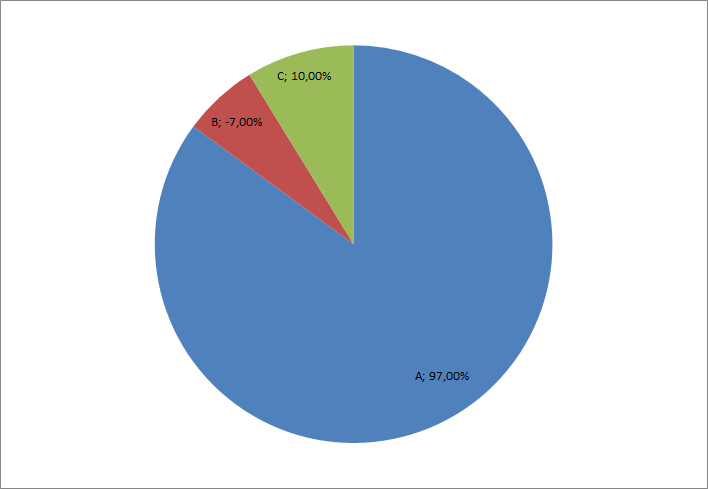
Here is what I want to achieve in Qliksense. The values sum up to 100% and whenever there is negative value, I want Qliksense to use the absolute value of the negative value to create the pie chart. In my example the total value would be 107%. I do not want to display the actual weights; since they will be adjusted to sum up to 100%. I want the actual values to be displayed like below.
Is there any way I can achieve this? Thank you.
- Mark as New
- Bookmark
- Subscribe
- Mute
- Subscribe to RSS Feed
- Permalink
- Report Inappropriate Content
Hi Li,
You can use FABS(expression) to use absolute value.
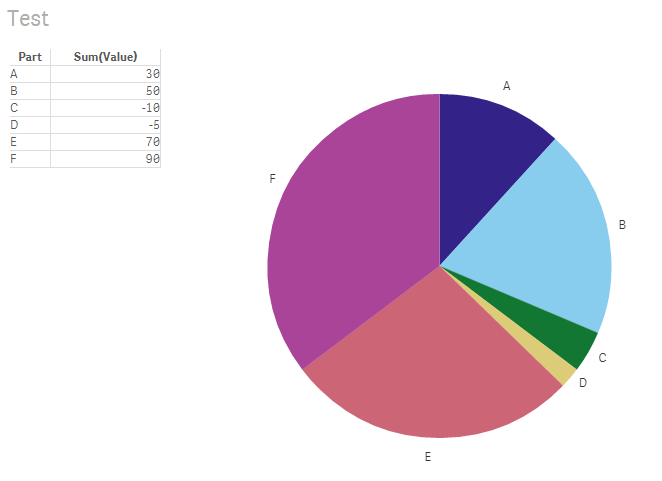
In my example FABS(Sum(Value)). I just see a problem to show your neg. values inside the pie chart because the FABS expression show only positive values & a separate expression (only for value inside graph) can't be created. Best would be to identify pos./neg. values by a color expression & using table to show real values.
Regards,
Ronny
- Mark as New
- Bookmark
- Subscribe
- Mute
- Subscribe to RSS Feed
- Permalink
- Report Inappropriate Content
This worked perfectly for me. Thanks!