Unlock a world of possibilities! Login now and discover the exclusive benefits awaiting you.
- Qlik Community
- :
- Forums
- :
- Analytics
- :
- New to Qlik Analytics
- :
- Re: Show only 3 FY trend
- Subscribe to RSS Feed
- Mark Topic as New
- Mark Topic as Read
- Float this Topic for Current User
- Bookmark
- Subscribe
- Mute
- Printer Friendly Page
- Mark as New
- Bookmark
- Subscribe
- Mute
- Subscribe to RSS Feed
- Permalink
- Report Inappropriate Content
Show only 3 FY trend
HI Experts!
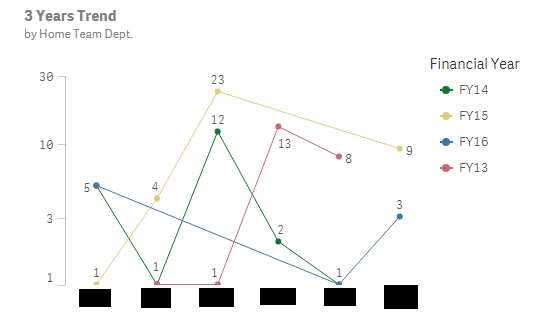
I would need help showing a 3 FY trend.

Here, it is showing me 4 FY trend, which is what I have in my excel data. Now I only want to show 3 FY ( Current FY and pas 2 FY)
I have a data columns in my excel telling me which fiscal year it is. (FY14,FY15,FY16,FY13,etc).
Thank You
~Jia sheng
- Mark as New
- Bookmark
- Subscribe
- Mute
- Subscribe to RSS Feed
- Permalink
- Report Inappropriate Content
Hi,
Do you have any Year field? (without the FY word). If yes, you can do a set analysis like this:
sum({<Year={'>=$(=max(Year)-2)'}>} Value)
This will get the year that is greater than the max year minus 2 years.
Now if you want to get the current year (Today()) minus 2 years (FY17,16,15)
sum({<Year={'>=$(=max(Year(Today()))-2)'}>} Value)
- Mark as New
- Bookmark
- Subscribe
- Mute
- Subscribe to RSS Feed
- Permalink
- Report Inappropriate Content
Hi Yddona,
I do not have a year field (without any FY word). I wanted to use something like this: fyear = {">$(=Max(fYear)-3)"}.
However it only works with numeric field.
- Mark as New
- Bookmark
- Subscribe
- Mute
- Subscribe to RSS Feed
- Permalink
- Report Inappropriate Content
If you want the current year, you can use the Today() function.
Do you have any date field? If really don't have, I recommend you create your own Year field to identify numerically the FY.
- Mark as New
- Bookmark
- Subscribe
- Mute
- Subscribe to RSS Feed
- Permalink
- Report Inappropriate Content
Hi Jia,
try this:
if (aggr(rank(Sum(Your Value)), FY) <= 3, FY, Null()) and forget to surpress the Null-Values
i hope that helps
beck