Unlock a world of possibilities! Login now and discover the exclusive benefits awaiting you.
- Qlik Community
- :
- Forums
- :
- Analytics
- :
- New to Qlik Analytics
- :
- Re: Showing Timestamp as Measure(SLA Tracking)
- Subscribe to RSS Feed
- Mark Topic as New
- Mark Topic as Read
- Float this Topic for Current User
- Bookmark
- Subscribe
- Mute
- Printer Friendly Page
- Mark as New
- Bookmark
- Subscribe
- Mute
- Subscribe to RSS Feed
- Permalink
- Report Inappropriate Content
Showing Timestamp as Measure(SLA Tracking)
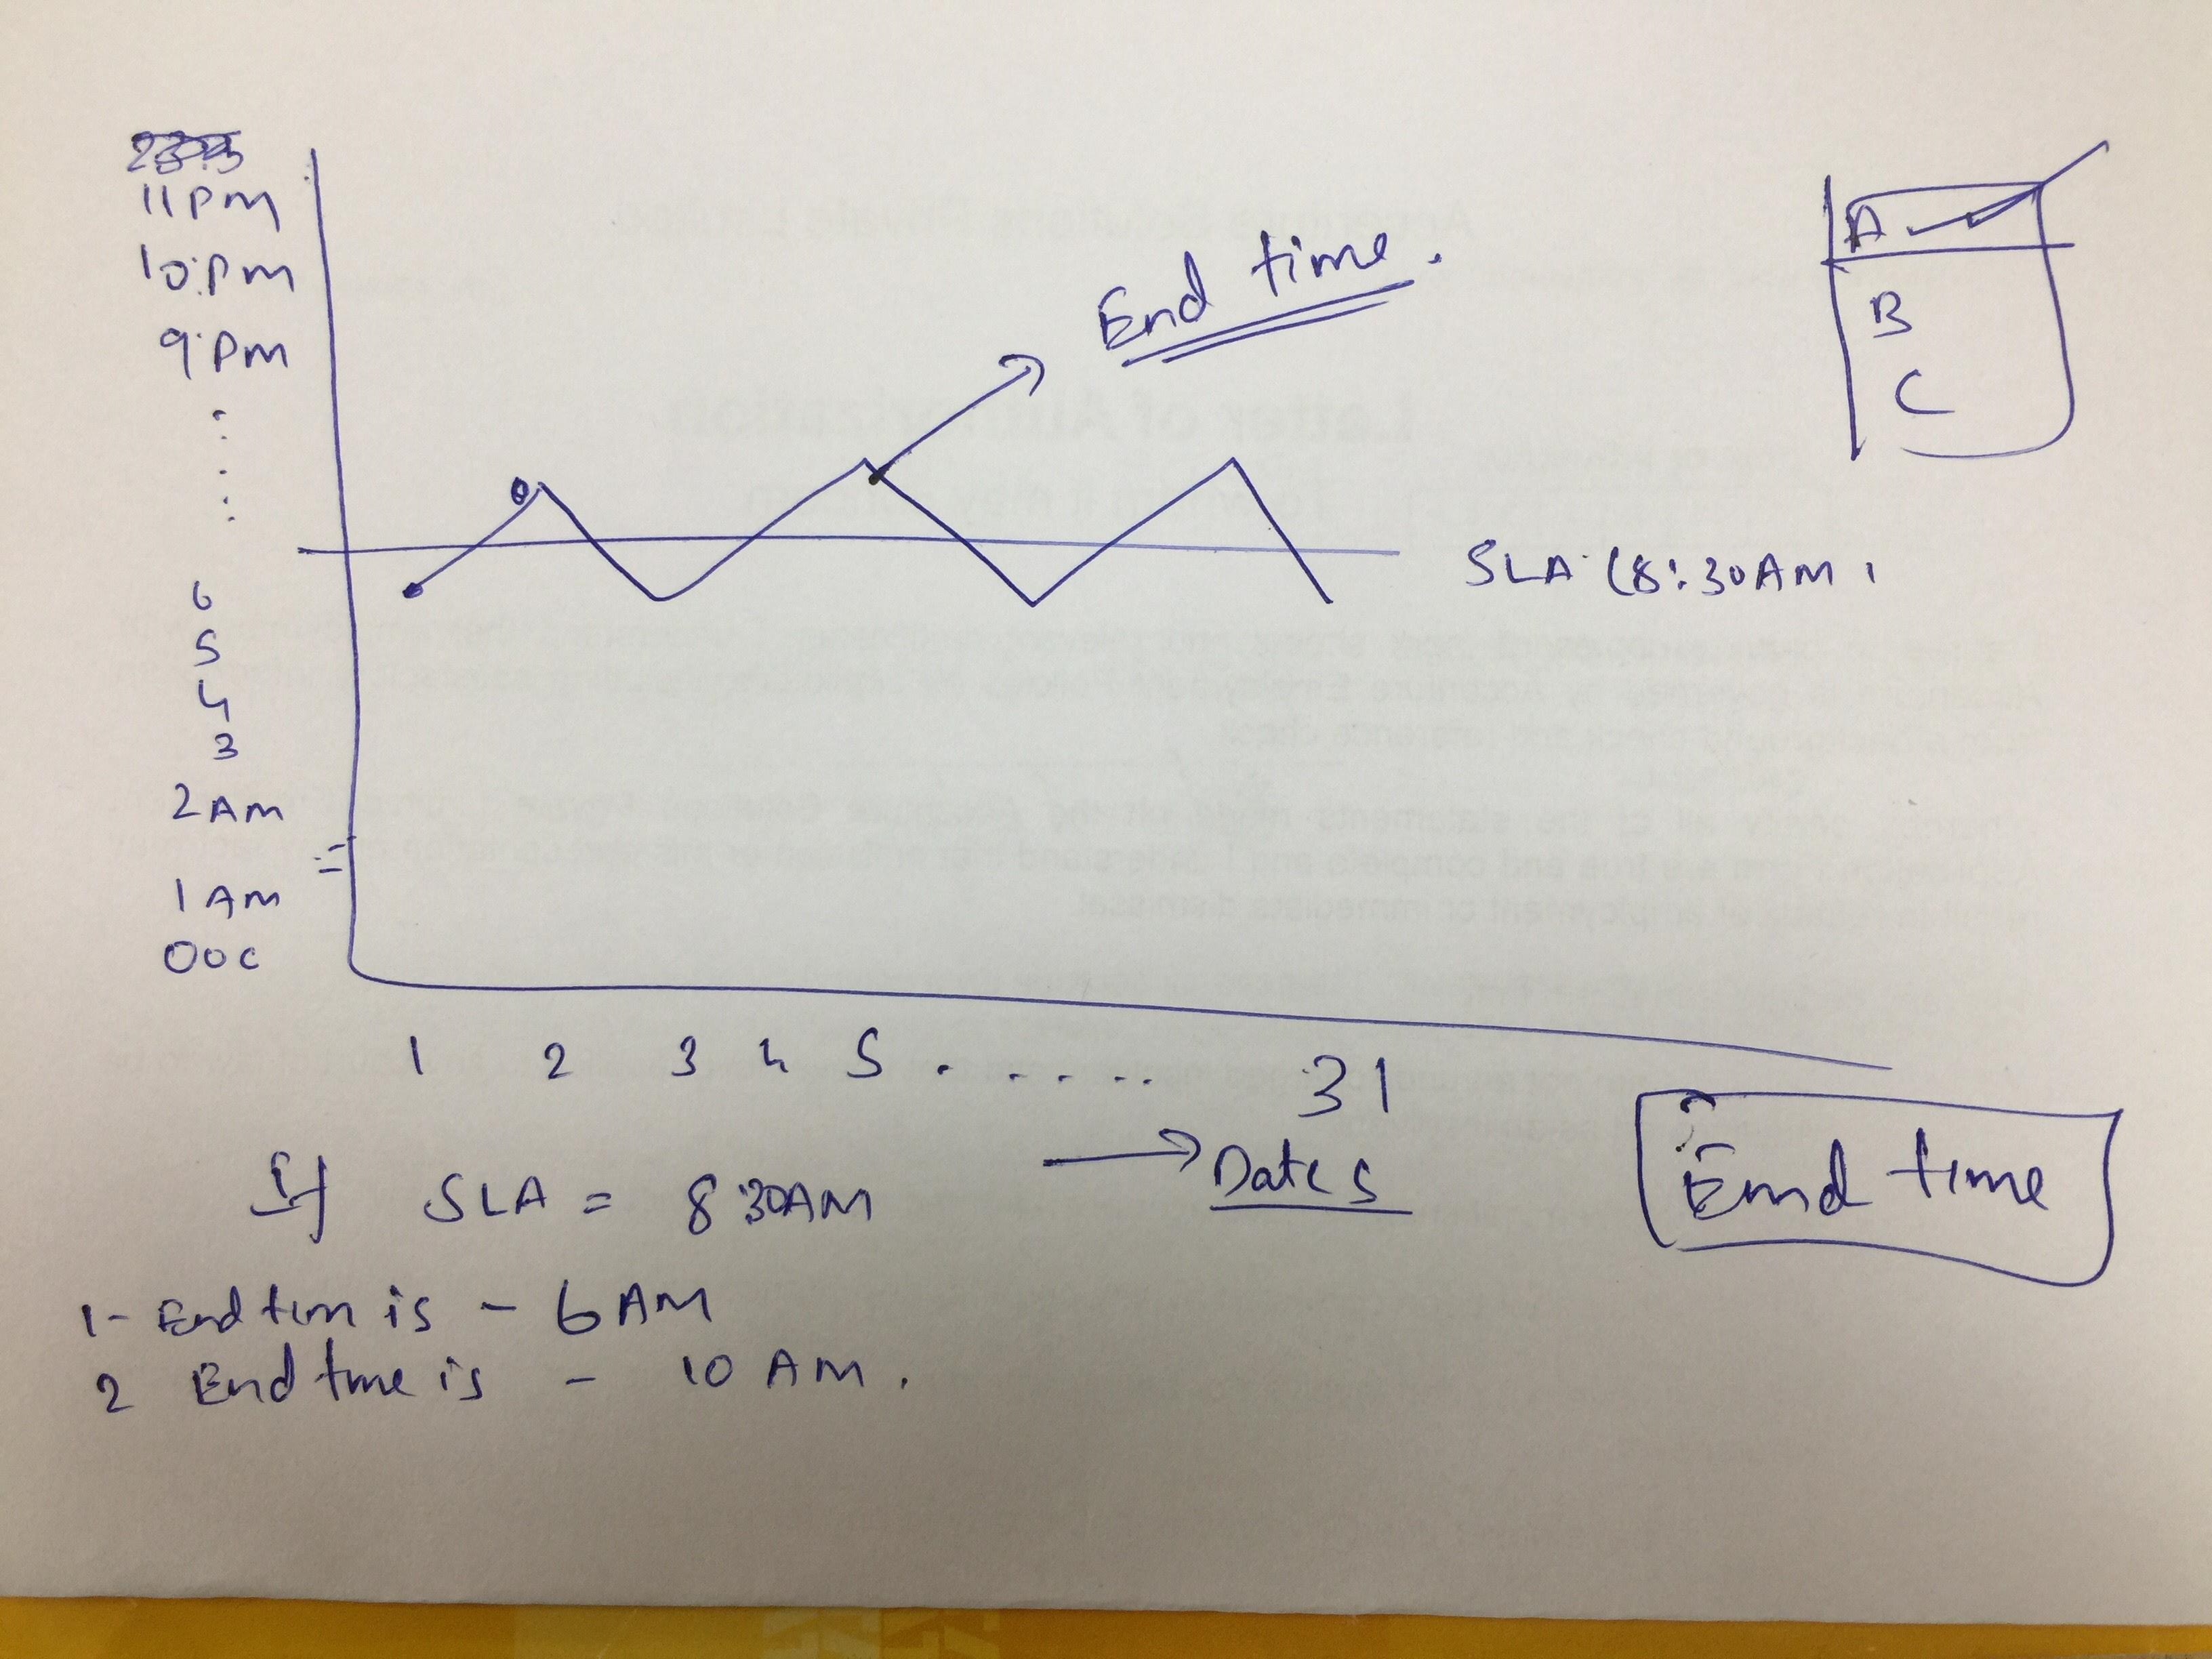
Hi I am trying to create a chart similar to below one. (Attached Sample Application)
On left I have time as axis. (24 hours)
At the bottom I have Dates
I need to show on each date at what time a particular application completed.
The reference line should be the SLA time.
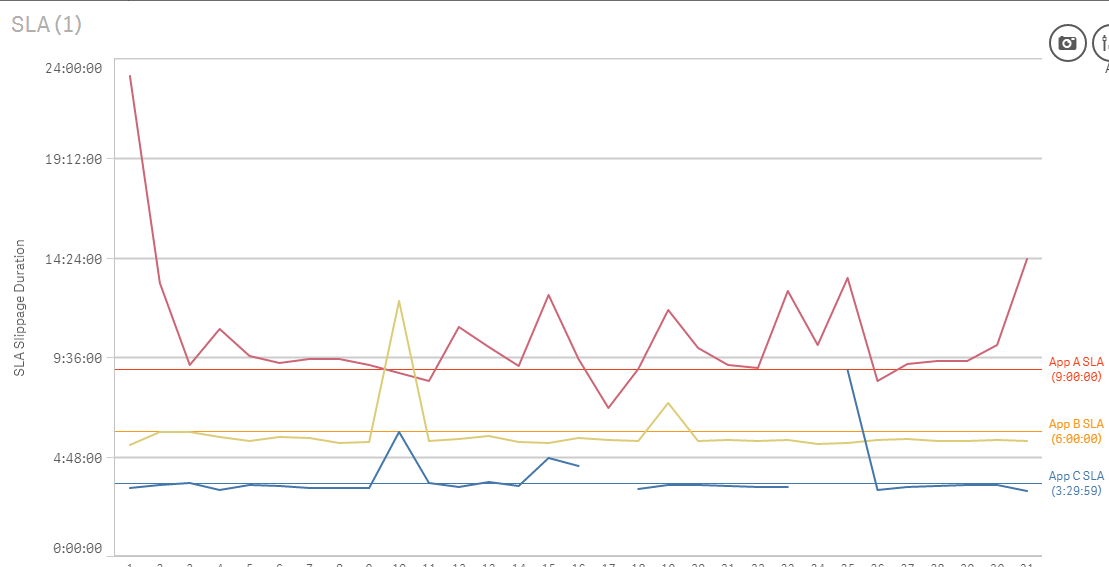
I was able to get a SLA deviation in the first sheet of the app attached. But I need to show the actualtime in a different sheet.
Any help is appreciated. stalwar1
- Tags:
- time chart
Accepted Solutions
- Mark as New
- Bookmark
- Subscribe
- Mute
- Subscribe to RSS Feed
- Permalink
- Report Inappropriate Content
Hi,
something like this? You either set individual reference line for each app or you can conditionally calculate the chart only if one app is selected.
- Mark as New
- Bookmark
- Subscribe
- Mute
- Subscribe to RSS Feed
- Permalink
- Report Inappropriate Content
Hi,
something like this? You either set individual reference line for each app or you can conditionally calculate the chart only if one app is selected.
- Mark as New
- Bookmark
- Subscribe
- Mute
- Subscribe to RSS Feed
- Permalink
- Report Inappropriate Content
Hi Juraj, Thanks Much.
Yup exactly the same.
Can you please share how it has been done?
- Mark as New
- Bookmark
- Subscribe
- Mute
- Subscribe to RSS Feed
- Permalink
- Report Inappropriate Content
Check the last sheet of attached app 
- Mark as New
- Bookmark
- Subscribe
- Mute
- Subscribe to RSS Feed
- Permalink
- Report Inappropriate Content
Thanks much
What impact does the Only() function has on expression here? like how did you end up using it?
- Mark as New
- Bookmark
- Subscribe
- Mute
- Subscribe to RSS Feed
- Permalink
- Report Inappropriate Content
The Only function returns a value only in case there's only one value possible. Consider a table:
| ID | Value |
|---|---|
| 1 | 100 |
| 2 | 200 |
| 3 | 200 |
When I do not select any ID, result of Only(Value) is Null(). If I select ID=1, then Only(Value) = 100. When I select both ID=2 and ID=3, the result is 200 (because Qlik considers those two values as a single distinct value).
The reason I used it was that I needed to use a set analysis expression, which can only be included in an aggregation function, such as Sum(), Count()... or Only().