Unlock a world of possibilities! Login now and discover the exclusive benefits awaiting you.
- Qlik Community
- :
- Forums
- :
- Analytics
- :
- New to Qlik Analytics
- :
- Showing negative values in Year over year by month
- Subscribe to RSS Feed
- Mark Topic as New
- Mark Topic as Read
- Float this Topic for Current User
- Bookmark
- Subscribe
- Mute
- Printer Friendly Page
- Mark as New
- Bookmark
- Subscribe
- Mute
- Subscribe to RSS Feed
- Permalink
- Report Inappropriate Content
Showing negative values in Year over year by month
Hi all,
I want to show a line graph where it displays Year over year by month of count of invitations.
I want to show graph for previous and current year.
I have tried with
Dimension : year and Month
Expression :
count({<DateType = {invitation},Year = {$(=max(Year))}>}invitation_id)-count({<DateType = {invitation},Year ={$(=max(Year)-1)}>}invitation_id)
I think there is wrong in my expression.So it is showing negative values I have attached qvf file .
Please help me in this regard.Any kind of help is appreciated.
Regards.
- Tags:
- year over year
- yoy
- « Previous Replies
- Next Replies »
- Mark as New
- Bookmark
- Subscribe
- Mute
- Subscribe to RSS Feed
- Permalink
- Report Inappropriate Content
In a set analysis expression the set is calculated at the chart level, not the row level. That's why records of one year cannot show data from the previous year using set analysis. See this document for a description of the problem and some solutions:Calculating rolling n-period totals, averages or other aggregations
talk is cheap, supply exceeds demand
- Mark as New
- Bookmark
- Subscribe
- Mute
- Subscribe to RSS Feed
- Permalink
- Report Inappropriate Content
remove year from dimension and check
- Mark as New
- Bookmark
- Subscribe
- Mute
- Subscribe to RSS Feed
- Permalink
- Report Inappropriate Content
Hi,
Thanks for reply
If i remove year it shows same negative values.
Here should i get counts of invitation of month or years??
Can you say the formula for this to calculate, PLease.
- Mark as New
- Bookmark
- Subscribe
- Mute
- Subscribe to RSS Feed
- Permalink
- Report Inappropriate Content
check this image reason for getting negative values
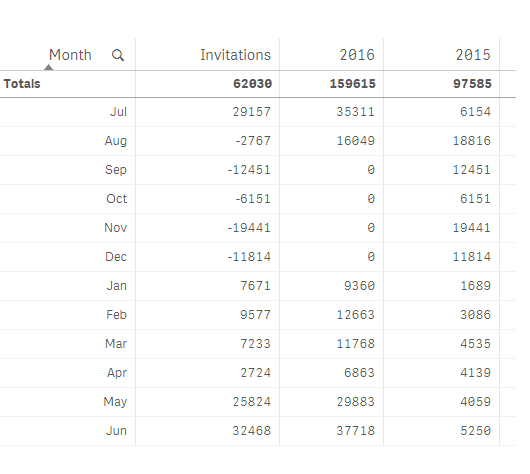
if you want to convert negative to positive
try this
fabs(count({<DateType = {invitation},
Year = {$(=max(Year))}>}invitation_id)-count({<DateType = {invitation},
Year = {$(=max(Year)-1)}>}invitation_id)
)
- Mark as New
- Bookmark
- Subscribe
- Mute
- Subscribe to RSS Feed
- Permalink
- Report Inappropriate Content
Hi,
Can you check my qvf file,
i have datas for all year and month.You can see that by taking only count of 2015 or 2016.
One more thing, i am using canonical date to store all date_created of invitation,and getting counts of it.
Now i want to get counts of invitation created in this year and last year. So can you check my attached file.
- Mark as New
- Bookmark
- Subscribe
- Mute
- Subscribe to RSS Feed
- Permalink
- Report Inappropriate Content
Hi,
with this below expression
fabs(count({<DateType = {invitation},
Canon_Year = {"$(=year(max(CanonicalDate)))"}>}invitation_id)-count({<DateType = {invitation},
Canon_Year = {"$(=year(max(CanonicalDate))-1)"}>}invitation_id))
i am able to get rid of negative values, but i need to add one more expression for graph,how to add one more count.
Please help me on this
- Mark as New
- Bookmark
- Subscribe
- Mute
- Subscribe to RSS Feed
- Permalink
- Report Inappropriate Content
what is it?
- Mark as New
- Bookmark
- Subscribe
- Mute
- Subscribe to RSS Feed
- Permalink
- Report Inappropriate Content
Course Completed Counts
that is :
fabs(count({<DateType = {Completed},
Canon_Year = {"$(=year(max(CanonicalDate)))"}>}course_completed)-count({<DateType = {Completed},
Canon_Year = {"$(=year(max(CanonicalDate))-1)"}>}course_completed)).
i want to show counts of YOY by Month of Invitations and CourseCompleted.
- Mark as New
- Bookmark
- Subscribe
- Mute
- Subscribe to RSS Feed
- Permalink
- Report Inappropriate Content
i dont understand you want add this expression with above expression?
- « Previous Replies
- Next Replies »