Unlock a world of possibilities! Login now and discover the exclusive benefits awaiting you.
- Qlik Community
- :
- Forums
- :
- Analytics
- :
- New to Qlik Analytics
- :
- Showing one dimension label instead of two dimensi...
- Subscribe to RSS Feed
- Mark Topic as New
- Mark Topic as Read
- Float this Topic for Current User
- Bookmark
- Subscribe
- Mute
- Printer Friendly Page
- Mark as New
- Bookmark
- Subscribe
- Mute
- Subscribe to RSS Feed
- Permalink
- Report Inappropriate Content
Showing one dimension label instead of two dimensions in graph
Hi,
i have a bar graph where i have two dimensions. Here i need to show only one dimension and hide other Dimension labeling.
Here i need to hide dimension marked in pink color.
How could i do this?
- Tags:
- bar graph
- Mark as New
- Bookmark
- Subscribe
- Mute
- Subscribe to RSS Feed
- Permalink
- Report Inappropriate Content
Hi,
You can select show legend option under Appearance>>Colors & Legend. this will hide the Second Dimension labels.

Thanks,
Maheen
vCreaTek LLC
- Mark as New
- Bookmark
- Subscribe
- Mute
- Subscribe to RSS Feed
- Permalink
- Report Inappropriate Content
Hi,
I dont think so it is possible.
Regards,
Kaushik Solanki
- Mark as New
- Bookmark
- Subscribe
- Mute
- Subscribe to RSS Feed
- Permalink
- Report Inappropriate Content
Hi,
Thanks for reply
Its not only hiding, By Whatever means i need to remove by script or expression.My goal is, It should not be visible in graph.
Is there any work around by expression or Script??
Regards,
Supriya
- Mark as New
- Bookmark
- Subscribe
- Mute
- Subscribe to RSS Feed
- Permalink
- Report Inappropriate Content
Hi,
Can you attach qvw file, So that it would be easy to give solution
- Mark as New
- Bookmark
- Subscribe
- Mute
- Subscribe to RSS Feed
- Permalink
- Report Inappropriate Content
Any update on this topic ? i am also facing same issue.
- Mark as New
- Bookmark
- Subscribe
- Mute
- Subscribe to RSS Feed
- Permalink
- Report Inappropriate Content
Hi,
I had the same requirement and the below steps proved beneficial.
Steps:
1. Select the chart.
2. Appearance -> X-axis -> Number of axis values = Max
3. Presentation -> Styling ->Outline width = Small -> Set Bar Width to maximum
- Mark as New
- Bookmark
- Subscribe
- Mute
- Subscribe to RSS Feed
- Permalink
- Report Inappropriate Content
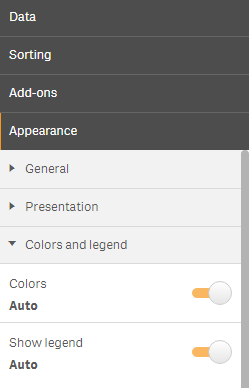
setting below color option to Auto removed the second dimension labels on x axis.
- Mark as New
- Bookmark
- Subscribe
- Mute
- Subscribe to RSS Feed
- Permalink
- Report Inappropriate Content
works perfect! thanks!
- Mark as New
- Bookmark
- Subscribe
- Mute
- Subscribe to RSS Feed
- Permalink
- Report Inappropriate Content
I had to also Toggle on 'Show Legend'. Thank you all!
