Unlock a world of possibilities! Login now and discover the exclusive benefits awaiting you.
- Qlik Community
- :
- Forums
- :
- Analytics
- :
- New to Qlik Analytics
- :
- Re: Simple but giving unnecessary output
- Subscribe to RSS Feed
- Mark Topic as New
- Mark Topic as Read
- Float this Topic for Current User
- Bookmark
- Subscribe
- Mute
- Printer Friendly Page
- Mark as New
- Bookmark
- Subscribe
- Mute
- Subscribe to RSS Feed
- Permalink
- Report Inappropriate Content
Simple but giving unnecessary output
Hi All,
I have a Dimension : Date
Expression : Count(Distinct VID)
i want to show trends , so i taken Line Chart ... i have a 5 Days Data 09 to 13 March ...
But Line chart other date are also showing ....
i have master calander created for 1 Oct to till Date . i showing all the date in dimension ..
But i have data for 09 to 13 March ... So ideally is should show 09 to 13 March Data only
....Kindly confirm me why its happening.. please don't give suggestion to select date range with set analysis..
because i am going to get another date data also... so its now feasible to do set analysis for date..
also i tried in qlikview .. where shows correctly .. only 5 days in line chart with dimension and measures
- « Previous Replies
-
- 1
- 2
- Next Replies »
Accepted Solutions
- Mark as New
- Bookmark
- Subscribe
- Mute
- Subscribe to RSS Feed
- Permalink
- Report Inappropriate Content
check this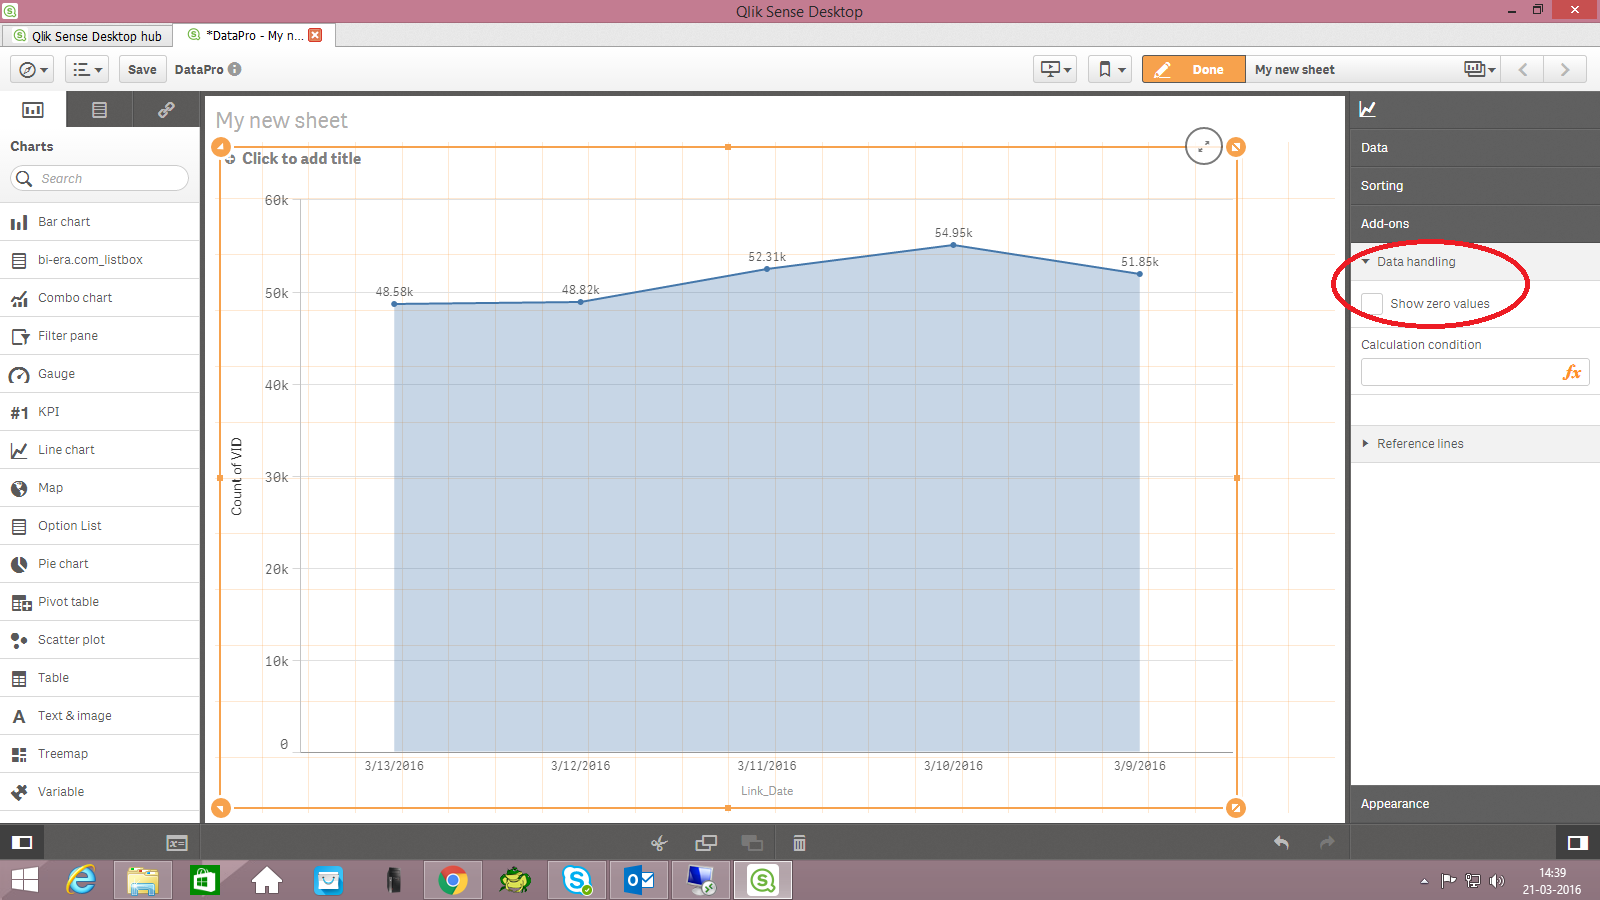
- Mark as New
- Bookmark
- Subscribe
- Mute
- Subscribe to RSS Feed
- Permalink
- Report Inappropriate Content
Disable 'Show NULL values' in chart properties - Add ons - data handling
- Mark as New
- Bookmark
- Subscribe
- Mute
- Subscribe to RSS Feed
- Permalink
- Report Inappropriate Content
Hi,
I already Disable Null Value option in line chart
- Mark as New
- Bookmark
- Subscribe
- Mute
- Subscribe to RSS Feed
- Permalink
- Report Inappropriate Content
Well, this option was not disabled in your sample file and if I do disable the option, I only get the dates with values >0.
- Mark as New
- Bookmark
- Subscribe
- Mute
- Subscribe to RSS Feed
- Permalink
- Report Inappropriate Content
Hi,
I am not able to open your qvf , its showing internal Error. Can u tell me any other solution for this
- Mark as New
- Bookmark
- Subscribe
- Mute
- Subscribe to RSS Feed
- Permalink
- Report Inappropriate Content
Hi All,
Can anyone suggest me on this .. I urgent need to solve this Problem.. and i am not getting any way as well to solve this
- Mark as New
- Bookmark
- Subscribe
- Mute
- Subscribe to RSS Feed
- Permalink
- Report Inappropriate Content
Please verify that you disabled this option (which wasn't in your original sample):
| Data handling | Calculation condition: Specify an expression in this text field to set a condition that needs to be fulfilled (true) for the object to be displayed. If the condition is not fulfilled, the message in the text box Displayed message is shown. The value may be entered as a calculated formula. For example: count(distinct Team)<3 A calculation condition is useful when a chart or table is very big and makes the visualization slow to respond. A calculation condition can then help so that for example an object does not show until the user has filtered the data to a more manageable level by applying selections. Show zero values: When unselected, measures that have the value ‘0’ are not included in the presentation. If there is more than one measure value, all the measure values must have the value ‘0’ to be excluded from the presentation. |
- Mark as New
- Bookmark
- Subscribe
- Mute
- Subscribe to RSS Feed
- Permalink
- Report Inappropriate Content
Hi Brijesh,
If yu have null values you can hide them using the check box in the dimension properties.
Also, if you are finding any '0' values, you can make use of the add-ons tab in the properties panel. You can curtail even the zero values from there.
Thanks,
Sangram.
- Mark as New
- Bookmark
- Subscribe
- Mute
- Subscribe to RSS Feed
- Permalink
- Report Inappropriate Content
Hi ,
i tried doing this ... But i am not getting done...Can u check my Qvf and try to do it on that
- Mark as New
- Bookmark
- Subscribe
- Mute
- Subscribe to RSS Feed
- Permalink
- Report Inappropriate Content
check this
- « Previous Replies
-
- 1
- 2
- Next Replies »