Unlock a world of possibilities! Login now and discover the exclusive benefits awaiting you.
- Qlik Community
- :
- Forums
- :
- Analytics
- :
- New to Qlik Analytics
- :
- Re: Stacked bar chart double values
- Subscribe to RSS Feed
- Mark Topic as New
- Mark Topic as Read
- Float this Topic for Current User
- Bookmark
- Subscribe
- Mute
- Printer Friendly Page
- Mark as New
- Bookmark
- Subscribe
- Mute
- Subscribe to RSS Feed
- Permalink
- Report Inappropriate Content
Stacked bar chart double values
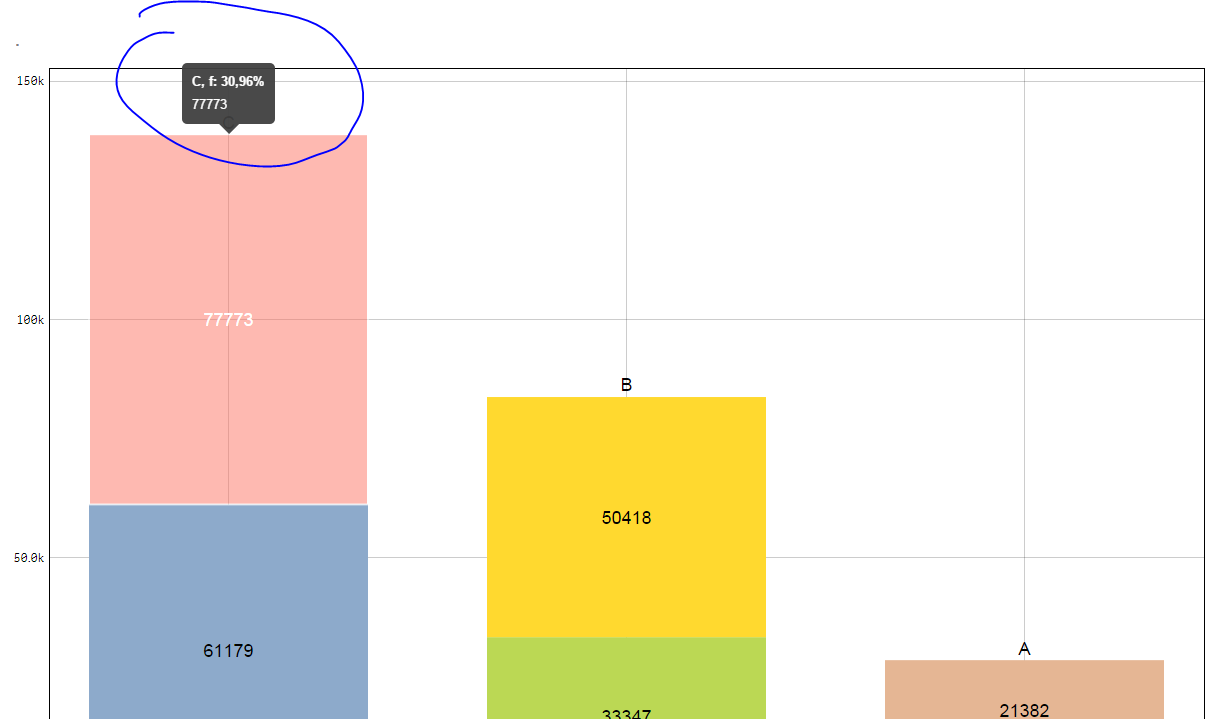
Hello guys, I have been wondering, Is it possible to show data points in stacked bar chart like in the picture?

I am attaching the qliksense file as well. I have thought that this is not possible, but as I see in this picture it is?
Anybody know how to do it?
-Greetings
Acho
- « Previous Replies
-
- 1
- 2
- Next Replies »
- Mark as New
- Bookmark
- Subscribe
- Mute
- Subscribe to RSS Feed
- Permalink
- Report Inappropriate Content
or u keep using the extension (with the same dimensions, measure)
and u'll see the percentage when u hover over a dimension:
- Mark as New
- Bookmark
- Subscribe
- Mute
- Subscribe to RSS Feed
- Permalink
- Report Inappropriate Content
Hi @tomovangel,
Any chance you came across a way to be able to create a stacked bar chart with percentages and values as shown on your screenshot (below)? Need to do the same if possible in Qlik so will appreciate any tips you may have to share. Interestingly enough, it appears it may be possible in Tableau (https://community.tableau.com/thread/244988)
- Mark as New
- Bookmark
- Subscribe
- Mute
- Subscribe to RSS Feed
- Permalink
- Report Inappropriate Content
Hi
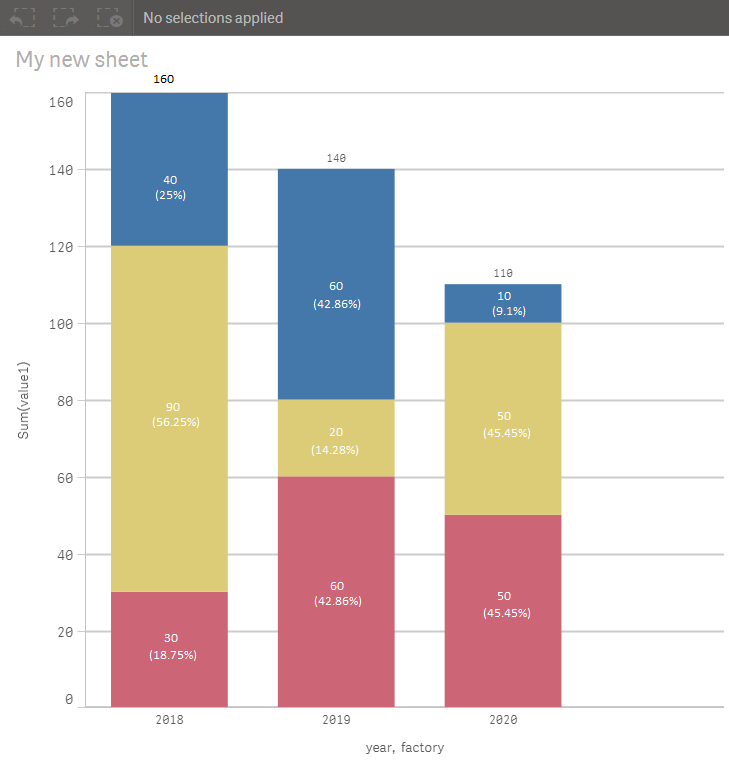
one solution would be to display both values in the expression by using the dual-function e.g.:
=Dual(Num(Sum(Quantity), '#,###.') & Chr(10) & Num(Sum(Quantity)/Sum(TOTAL <Market> Quantity), '##.##%'), Sum(Quantity))
This works fine with the bar & area chart object from the qlik visualization bundle but not with the regular bar chart-object (Qlik Sense April 2020).
- Mark as New
- Bookmark
- Subscribe
- Mute
- Subscribe to RSS Feed
- Permalink
- Report Inappropriate Content
Define the measure something like this:
Dual(
	Num(Sum(value1), '0') & chr(10) & '(' & Num(Sum(value1) / Sum(total value1), '0%') & '),
	Sum(value1)
)
This means the value will display the amount (Sum(value1)) and the percent, but will carry the value of the amount.
- « Previous Replies
-
- 1
- 2
- Next Replies »