Unlock a world of possibilities! Login now and discover the exclusive benefits awaiting you.
- Qlik Community
- :
- Forums
- :
- Analytics
- :
- New to Qlik Analytics
- :
- Standard Deviation in a chart
- Subscribe to RSS Feed
- Mark Topic as New
- Mark Topic as Read
- Float this Topic for Current User
- Bookmark
- Subscribe
- Mute
- Printer Friendly Page
- Mark as New
- Bookmark
- Subscribe
- Mute
- Subscribe to RSS Feed
- Permalink
- Report Inappropriate Content
Standard Deviation in a chart
Hi.
I need to calculate average and standard-deviation of stock-movements.
Average is calulated as following and working:
AVG(TOTAL Aggr(Sum([LV_M-Abgang-Gesamt]),[LV_JahrMonat/YearMonth]))
Standard-Deviation - actually no conclue. Tried a few approaches, but not working.
Target must be the standard-deviation related only(!) to the selected period.
Any idea ?
Regards,
Reinhold
- « Previous Replies
-
- 1
- 2
- Next Replies »
Accepted Solutions
- Mark as New
- Bookmark
- Subscribe
- Mute
- Subscribe to RSS Feed
- Permalink
- Report Inappropriate Content
I think you might need this
Stdev(Aggr(Sum([LV_M-Abgang-Gesamt]), Division, Lagerort, Artikelgruppe, [LV_JahrMonat/YearMonth]))
- Mark as New
- Bookmark
- Subscribe
- Mute
- Subscribe to RSS Feed
- Permalink
- Report Inappropriate Content
Did you try the Stdev() function? Stdev - chart function ‒ QlikView
Stdev(TOTAL Aggr(Sum([LV_M-Abgang-Gesamt]),[LV_JahrMonat/YearMonth]))
- Mark as New
- Bookmark
- Subscribe
- Mute
- Subscribe to RSS Feed
- Permalink
- Report Inappropriate Content
yes. No output
I tried as well:
Stdev(TOTAL
aggr(
sum (
{<[LV_JahrMonat/YearMonth]={'>=$(=min([LV_JahrMonat/YearMonth]))<=$(=max([LV_JahrMonat/YearMonth]))'}>}
[LV_M-Abgang-Gesamt], [LV_JahrMonat/YearMonth]
)
)
)
Same Result...
- Mark as New
- Bookmark
- Subscribe
- Mute
- Subscribe to RSS Feed
- Permalink
- Report Inappropriate Content
Would you be able to share a sample with the desired result?
- Mark as New
- Bookmark
- Subscribe
- Mute
- Subscribe to RSS Feed
- Permalink
- Report Inappropriate Content
Yes.
The calculated standard-deviation (21.826) is the target.
I also watched the following blog:
- Mark as New
- Bookmark
- Subscribe
- Mute
- Subscribe to RSS Feed
- Permalink
- Report Inappropriate Content
Can you attach the Excel here?
- Mark as New
- Bookmark
- Subscribe
- Mute
- Subscribe to RSS Feed
- Permalink
- Report Inappropriate Content
attached
- Mark as New
- Bookmark
- Subscribe
- Mute
- Subscribe to RSS Feed
- Permalink
- Report Inappropriate Content
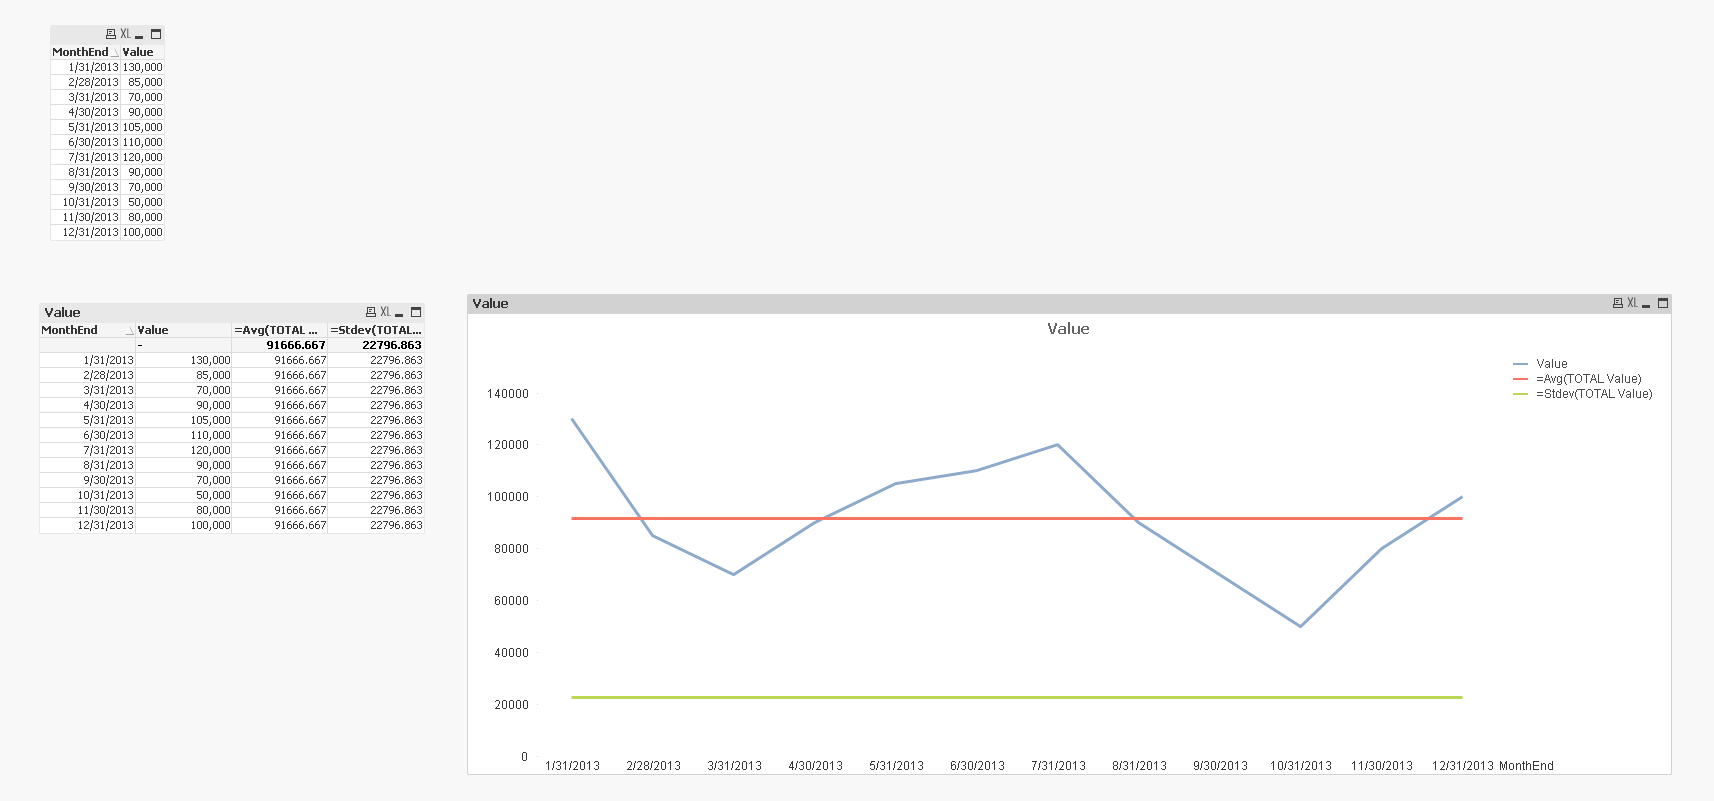
I know this is just a sample, but Stdev seems to be working here... the only difference is that it is sample standard deviation rather than populations standard deviation... for population, may be look here:
Help with Standard deviation Full population No... | Qlik Community
- Mark as New
- Bookmark
- Subscribe
- Mute
- Subscribe to RSS Feed
- Permalink
- Report Inappropriate Content
how does your formula for standard-dev. look like in this sample ?
- Mark as New
- Bookmark
- Subscribe
- Mute
- Subscribe to RSS Feed
- Permalink
- Report Inappropriate Content
Stdev(TOTAL Value)
- « Previous Replies
-
- 1
- 2
- Next Replies »