Unlock a world of possibilities! Login now and discover the exclusive benefits awaiting you.
- Qlik Community
- :
- Forums
- :
- Analytics
- :
- New to Qlik Analytics
- :
- Storage
- Subscribe to RSS Feed
- Mark Topic as New
- Mark Topic as Read
- Float this Topic for Current User
- Bookmark
- Subscribe
- Mute
- Printer Friendly Page
- Mark as New
- Bookmark
- Subscribe
- Mute
- Subscribe to RSS Feed
- Permalink
- Report Inappropriate Content
Storage
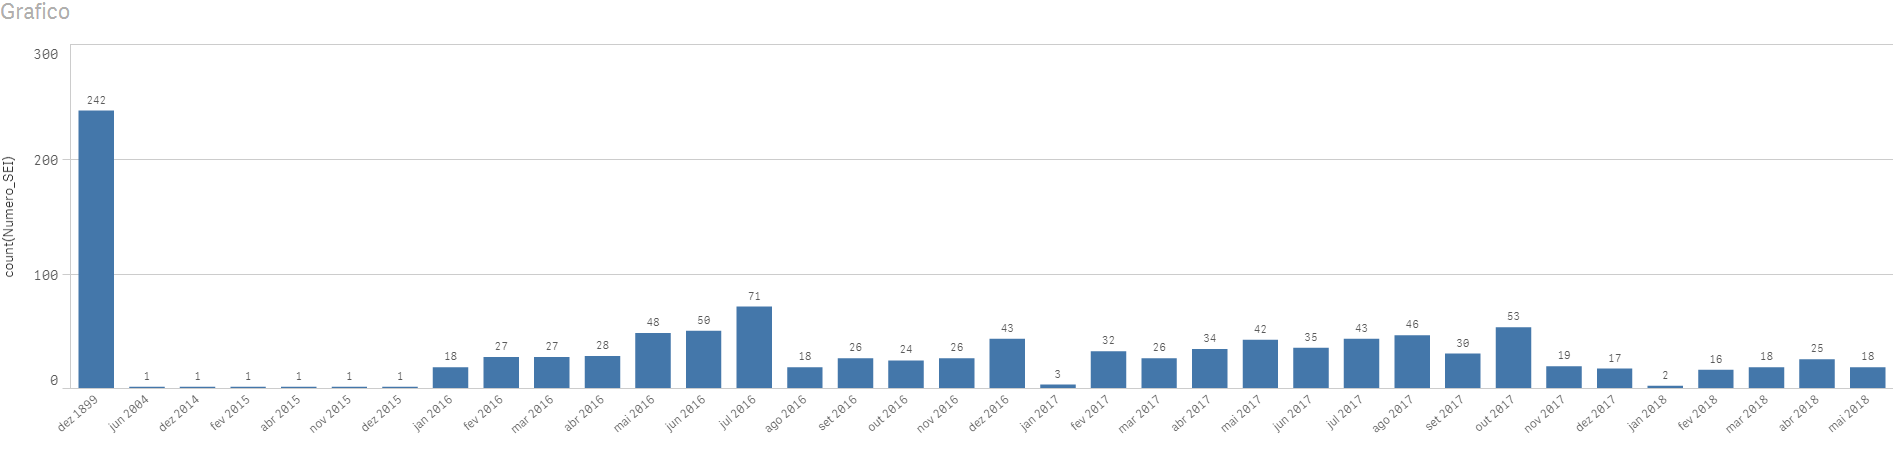
Guys, i need to make an in bar graph at QlikSense, showing the store of every month of the year (exemple image in annex), with the data:
Num_Document;
Entrence_Date;
Decision_Date;
The condicion will be:
if the document has decision date, then every month since decison date -1 (becase if the document had decision at the month X so the month X can't be storage, that's why the -1), until the entrence date had this document like storage, Else every month until today has the document like storage.
Document | Entrence | Decision | Jan/17 | Feb/17 | Mar/17 | Apr/17 | May/17 | Jun/17 |
X | 10/01/2017 | 10/05/2017 | 1 | 1 | 1 | 1 | 0 | 0 |
Y | 31/03/2017 | 31/10/2017 | 0 | 0 | 0 | 1 | 1 | 1 |
Z | 30/04/2017 | 30/04/2017 | 0 | 0 | 0 | 0 | 0 | 0 |
Storage: | 1 | 1 | 1 | 2 | 1 | 1 | ||
OBS: The Entrence date and Decision Date is uneven, change and repet depending on Entrence date and Decision Date, that is, in one day can entry alot of documents and in te other can be judge.
what i got: if(IsNull(Decision_Date) = -1, 0, Decision_Date) as Judge,