Unlock a world of possibilities! Login now and discover the exclusive benefits awaiting you.
- Qlik Community
- :
- Forums
- :
- Analytics
- :
- New to Qlik Analytics
- :
- Re: Strange behavior calculating Average
- Subscribe to RSS Feed
- Mark Topic as New
- Mark Topic as Read
- Float this Topic for Current User
- Bookmark
- Subscribe
- Mute
- Printer Friendly Page
- Mark as New
- Bookmark
- Subscribe
- Mute
- Subscribe to RSS Feed
- Permalink
- Report Inappropriate Content
Strange behavior calculating Average
Hello, im relatively new to qlik and im having trouble to find the correct expression to calculate an average.
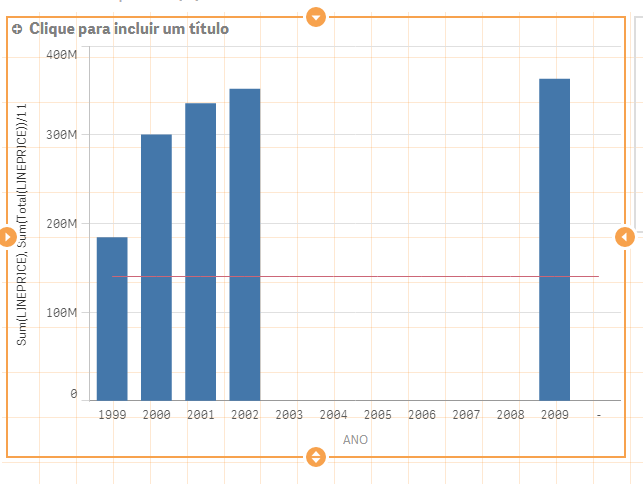
I'm trying to draw an avg line, sum of sales per count of years, in a combinated chart, but the result im getting is wrong.This is the expression im using : Sum(Total(LINEPRICE))/count(Distinct(ANO)).

As you can see, in a KPI object, count(distinct(ANO)) is working correctly, but not in the chart. Now if i change the expression in chart to Sum(Total(LINEPRICE)) / 11 i get the result as i expected:

Can someone, please, tell me what im doing wrong?
Thanks in advance and sorry for my english.
Accepted Solutions
- Mark as New
- Bookmark
- Subscribe
- Mute
- Subscribe to RSS Feed
- Permalink
- Report Inappropriate Content
- Mark as New
- Bookmark
- Subscribe
- Mute
- Subscribe to RSS Feed
- Permalink
- Report Inappropriate Content
What about
Sum(Total LINEPRICE)/count(TOTAL Distinct ANO)
- Mark as New
- Bookmark
- Subscribe
- Mute
- Subscribe to RSS Feed
- Permalink
- Report Inappropriate Content
Thanks a lot, that made it.
Can you, please, tell me why in KPI objec it worked as i intended but in chart i had to put the Total together with the distinct?
- Mark as New
- Bookmark
- Subscribe
- Mute
- Subscribe to RSS Feed
- Permalink
- Report Inappropriate Content
Because in the line chart you are splitting your calculation by each year(ano).
count(Distinct ANO) will return one value for each year.
- Mark as New
- Bookmark
- Subscribe
- Mute
- Subscribe to RSS Feed
- Permalink
- Report Inappropriate Content
The aggregation scope is different in both cases.
If you use Count(DISTINCT ANO) in a text box, it will do a count distinct using all possible ANO values.
If you use it in a chart with a dimension, it will only do the distinct count for the possible values with a relation to the dimensional value. If you are using ANO as dimension, this will return 1 for all dimensional values.