Unlock a world of possibilities! Login now and discover the exclusive benefits awaiting you.
- Qlik Community
- :
- Forums
- :
- Analytics
- :
- New to Qlik Analytics
- :
- Subtracting rows in pivot table
- Subscribe to RSS Feed
- Mark Topic as New
- Mark Topic as Read
- Float this Topic for Current User
- Bookmark
- Subscribe
- Mute
- Printer Friendly Page
- Mark as New
- Bookmark
- Subscribe
- Mute
- Subscribe to RSS Feed
- Permalink
- Report Inappropriate Content
Subtracting rows in pivot table
Hi everyone,
I was about to create a sort of "income statement" (profit and loss) in qlik Sense. I tried the extension P&L Smart, but it is actually too limited for what I meant to do. A pivot table, instead, might suit better. However, before starting, I wanted to know whether it is possible to subtract two specific rows in a pivot table, and if yes, how.
I know it's possible to create a P6L Statement in View, but I don't find any material related to Sense.
e.g. I have
Operating revenues
Operating expenses.
I want to create a new row, say, Gross Profit, that is "Operating revenues"-"Operating expenses".
Thanks in advance.
- « Previous Replies
-
- 1
- 2
- Next Replies »
Accepted Solutions
- Mark as New
- Bookmark
- Subscribe
- Mute
- Subscribe to RSS Feed
- Permalink
- Report Inappropriate Content
Thanks for your help. Anyway, I finally managed to follow this guide
https://community.qlik.com/docs/DOC-3324
and adapt everything to QlikSense.
After some work, here's the result. (please see attachment).
- Mark as New
- Bookmark
- Subscribe
- Mute
- Subscribe to RSS Feed
- Permalink
- Report Inappropriate Content
Hi Gabriele,
if you already tried to work with extension: P&L Smart, in this extension you use only 2 diimension, you can use for your issue: the straighttable, please check this web-page: https://www.vizlib.com/table/#4whatsnew
or you give me an example screenshot and we will find another solution
i hope that helps
Beck
- Mark as New
- Bookmark
- Subscribe
- Mute
- Subscribe to RSS Feed
- Permalink
- Report Inappropriate Content
I need exactly what a pivot table does in Qlik sense, i.e., the possibility of expanding fields.
However, a need also to subtract rows, and that's not easy to do. Does that extension do the job?
- Mark as New
- Bookmark
- Subscribe
- Mute
- Subscribe to RSS Feed
- Permalink
- Report Inappropriate Content
Hi Gabriele,
can you give me an example screenshot of your expected output
- Mark as New
- Bookmark
- Subscribe
- Mute
- Subscribe to RSS Feed
- Permalink
- Report Inappropriate Content
Can you show us what you have? (an image)
the measures you're using and you want to do?
It would be much easier to help you that way 
- Mark as New
- Bookmark
- Subscribe
- Mute
- Subscribe to RSS Feed
- Permalink
- Report Inappropriate Content
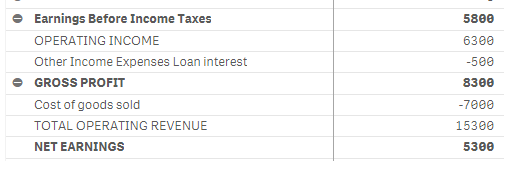
Sure, sorry but I thought somebody already tried to replicate a profit and loss statement before
I actually need something like this. With, let's say, Net earnings being the difference between "Earnings before income and taxes" and "Gross profit" (that's not economiccaly right, but it's just an example to show what I needed to do).
Thanks
- Mark as New
- Bookmark
- Subscribe
- Mute
- Subscribe to RSS Feed
- Permalink
- Report Inappropriate Content
please see below the answer to omar. thanks
- Mark as New
- Bookmark
- Subscribe
- Mute
- Subscribe to RSS Feed
- Permalink
- Report Inappropriate Content
Hi Gabriele,
what do you think about it?
Beck
- Mark as New
- Bookmark
- Subscribe
- Mute
- Subscribe to RSS Feed
- Permalink
- Report Inappropriate Content
Sure you can;
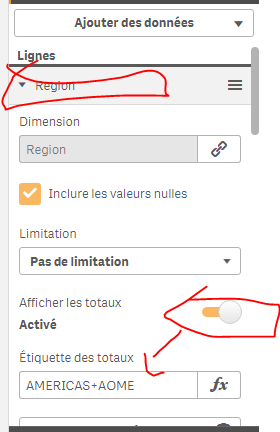
1)Activate the total in your first dimension
2) suppose your expression is : sum(sales)
replace it like this:
if(dimensionality()=0,sum({Dim1={'Earning before incomes'}Sales)-sum({'GROSS PROFIT'}Sales),
sum(Sales))
per analogy:
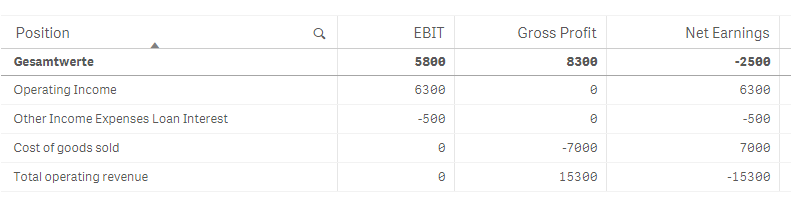
I have in the below table:
- 2 dimensions: OICA region and territory code:
1) I activate the total in the first dimension :
2) then altered my measure as follow:
if(Dimensionality()=0,Sum({<[OICA region]={'AOME','Americas'}>}[Commercial vehicle production]),
sum([Commercial vehicle production]))
ps: dimensionality()=1 is the first dimension
dimensionality()=2 is the second dimension and so on
dimensionality()=0 is the total
so with my measure; for the total row I called Aome+americas, I want to have the car production for aome+americas.
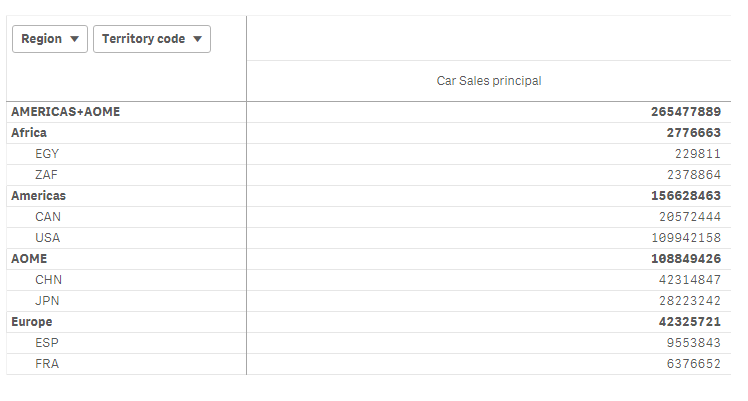
You have the idea, alter your expression to answer your question
hope this helps
- Mark as New
- Bookmark
- Subscribe
- Mute
- Subscribe to RSS Feed
- Permalink
- Report Inappropriate Content
Hi Omar,
How are you, i hope you are well,
it does look great, do you have an qvf-example?
Thanks a lot
Beck
- « Previous Replies
-
- 1
- 2
- Next Replies »