Unlock a world of possibilities! Login now and discover the exclusive benefits awaiting you.
- Qlik Community
- :
- Forums
- :
- Analytics
- :
- New to Qlik Analytics
- :
- Sum and age on latest transaction
Options
- Subscribe to RSS Feed
- Mark Topic as New
- Mark Topic as Read
- Float this Topic for Current User
- Bookmark
- Subscribe
- Mute
- Printer Friendly Page
Turn on suggestions
Auto-suggest helps you quickly narrow down your search results by suggesting possible matches as you type.
Showing results for
Contributor
2017-11-14
08:34 AM
- Mark as New
- Bookmark
- Subscribe
- Mute
- Subscribe to RSS Feed
- Permalink
- Report Inappropriate Content
Sum and age on latest transaction
| Customer | Tdate | Value |
| A | 1-Nov-2015 | 150 |
| A | 1-Nov-2016 | 200 |
| A | 1-Nov-2017 | 100 |
| A | 1-Oct-2017 | 80 |
| B | 24-Dec-2012 | 30011 |
| B | 24-Dec-2015 | 22 |
| B | 24-Dec-2014 | 28 |
| C | 16-Sep-2013 | 34 |
| C | 17-Sep-2013 | 12 |
How can i create a chart in Sense that has the sum(value), latest Tdate and Age(Latest Tdate - Now())?
Please assist.
1,185 Views
1 Solution
Accepted Solutions
Specialist
2017-11-14
09:43 AM
- Mark as New
- Bookmark
- Subscribe
- Mute
- Subscribe to RSS Feed
- Permalink
- Report Inappropriate Content
1,077 Views
7 Replies
Partner - Master III
2017-11-14
08:42 AM
- Mark as New
- Bookmark
- Subscribe
- Mute
- Subscribe to RSS Feed
- Permalink
- Report Inappropriate Content
Use below code in script n then try
Load Customer,
Max(Tdate) as Latest_Tdate,
Sum(Value) as Value,
Age(today(),max(Tdate)) as Age
From Source
Group by Customer;
1,077 Views
Contributor
2017-11-14
09:07 AM
Author
- Mark as New
- Bookmark
- Subscribe
- Mute
- Subscribe to RSS Feed
- Permalink
- Report Inappropriate Content
I am not able to access the source thus i cant do it from load statement.
1,077 Views
Partner - Champion
2017-11-14
09:18 AM
- Mark as New
- Bookmark
- Subscribe
- Mute
- Subscribe to RSS Feed
- Permalink
- Report Inappropriate Content
what chart type you are planning to use ?
1,077 Views
Contributor
2017-11-14
09:25 AM
Author
- Mark as New
- Bookmark
- Subscribe
- Mute
- Subscribe to RSS Feed
- Permalink
- Report Inappropriate Content
Just a table
1,077 Views
Master III
2017-11-14
09:32 AM
- Mark as New
- Bookmark
- Subscribe
- Mute
- Subscribe to RSS Feed
- Permalink
- Report Inappropriate Content
May be this

Specialist
2017-11-14
09:43 AM
- Mark as New
- Bookmark
- Subscribe
- Mute
- Subscribe to RSS Feed
- Permalink
- Report Inappropriate Content
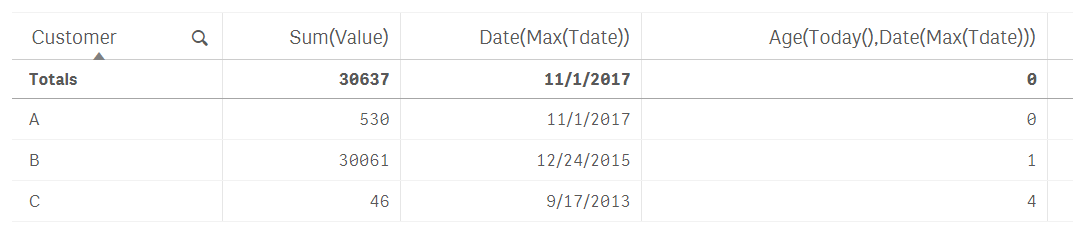
Is this what you need
1,078 Views
Partner - Champion
2017-11-14
09:49 AM
- Mark as New
- Bookmark
- Subscribe
- Mute
- Subscribe to RSS Feed
- Permalink
- Report Inappropriate Content
could you please post a screenshot of your expected result?
1,077 Views
Community Browser