Unlock a world of possibilities! Login now and discover the exclusive benefits awaiting you.
- Qlik Community
- :
- Forums
- :
- Analytics
- :
- New to Qlik Analytics
- :
- Re: Sum if with a set year
- Subscribe to RSS Feed
- Mark Topic as New
- Mark Topic as Read
- Float this Topic for Current User
- Bookmark
- Subscribe
- Mute
- Printer Friendly Page
- Mark as New
- Bookmark
- Subscribe
- Mute
- Subscribe to RSS Feed
- Permalink
- Report Inappropriate Content
Sum if with a set year
Hi - I have the below expression that is working for a survey results. The table shows results as below.
100*Sum(IF([Would Recommend]='Yes',1,0))/Sum(IF([Would Recommend]='Yes' or [Would Recommend]='No',1,0))

I want to show only 2016FY and 2017YTD without users having to select years. The year is called "Completed Year". Ideally, I want to have the table to look like this. But I don't think it's possible. So if you could tell me how I can get to the expression to show just the 2016 without selecting any year filter, that would be a great start for me.

I tried this but of course it doesn't work..
100*Sum({1}IF([Completed Year]='2016' and [Would Recommend]='Yes',1,0))/Sum(IF([[Completed Year]='2016' and [Would Recommend]='Yes' or [Would Recommend]='No',1,0))
Thank you!
- « Previous Replies
-
- 1
- 2
- Next Replies »
Accepted Solutions
- Mark as New
- Bookmark
- Subscribe
- Mute
- Subscribe to RSS Feed
- Permalink
- Report Inappropriate Content
(I've made some assumptions about your data, so if it doesn't work, please attach your app.)
First, you can simplify the original expression:
100*count({<[Would Recommend]={'Yes'}>} [Would Recommend])/count([Would Recommend])
Next, for the year 2016:
100*count({<[Would Recommend]={'Yes'}, [Completed Year]={2016}>} [Would Recommend])/count({<[Completed Year]={2016}>} [Would Recommend])
I hope you can figure out the rest...
- Mark as New
- Bookmark
- Subscribe
- Mute
- Subscribe to RSS Feed
- Permalink
- Report Inappropriate Content
Hi,
Would you be able to attach a sample app or data set?
Thanks
- Mark as New
- Bookmark
- Subscribe
- Mute
- Subscribe to RSS Feed
- Permalink
- Report Inappropriate Content
(I've made some assumptions about your data, so if it doesn't work, please attach your app.)
First, you can simplify the original expression:
100*count({<[Would Recommend]={'Yes'}>} [Would Recommend])/count([Would Recommend])
Next, for the year 2016:
100*count({<[Would Recommend]={'Yes'}, [Completed Year]={2016}>} [Would Recommend])/count({<[Completed Year]={2016}>} [Would Recommend])
I hope you can figure out the rest...
- Mark as New
- Bookmark
- Subscribe
- Mute
- Subscribe to RSS Feed
- Permalink
- Report Inappropriate Content
Thank you for this! The expression itself works perfectly. Now my table looks like this, mind you, I need to do 2016 and 2017 for other categories as well but I can probably apply the same to them. Problem here is I need to have the Year as columns and Recommend in row, but I can't figure out how to make the visualization work that way. :[

- Mark as New
- Bookmark
- Subscribe
- Mute
- Subscribe to RSS Feed
- Permalink
- Report Inappropriate Content
Here is an example of a table without the real dimensions. Actually, there is a dimension there, based on ValueList() function.
Of course it is not a solution but an idea how you can build your table. I'm just using dummy expressions here,
- Mark as New
- Bookmark
- Subscribe
- Mute
- Subscribe to RSS Feed
- Permalink
- Report Inappropriate Content
I actually don't know how to open the qvf file. Could you please direct me to a thread that may have instructions on how to view that? Thank you.
- Mark as New
- Bookmark
- Subscribe
- Mute
- Subscribe to RSS Feed
- Permalink
- Report Inappropriate Content
Well, you're on Sense forums, and your screenshots look "sensy" ![]() ,that is qvf.
,that is qvf.
Anyway... First, you download the file. Next:
If you have Qlik Sense Desktop, copy the file into C:\Users\<actual user, that is yourself>\Documents\Qlik\Sense\Apps
If you use Qlik Server, you have to go Applications, and import the file.
- Mark as New
- Bookmark
- Subscribe
- Mute
- Subscribe to RSS Feed
- Permalink
- Report Inappropriate Content
I don't have Qlik Sense Desktop, so when I try to import the saved qvf file from the app, it says the file format is not supported, looks like only qvd and qvx..
- Mark as New
- Bookmark
- Subscribe
- Mute
- Subscribe to RSS Feed
- Permalink
- Report Inappropriate Content
QMC certainly can import qvf files. Maybe it is a version difference (?) I saved it now in an older version, see if you can import it now.
- Mark as New
- Bookmark
- Subscribe
- Mute
- Subscribe to RSS Feed
- Permalink
- Report Inappropriate Content
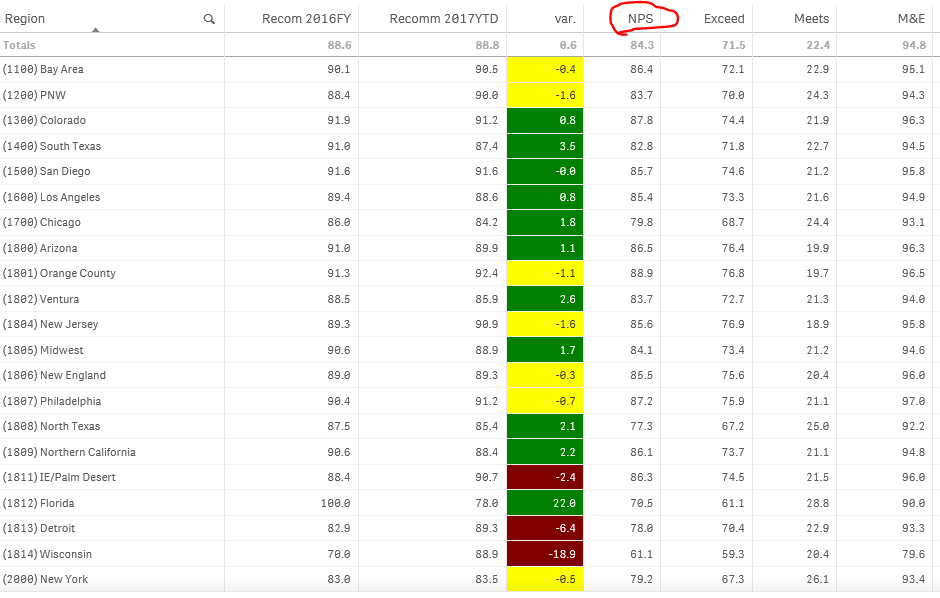
It still says the file is not supported;; I will ask another staff here in a bit to see how they are importing. I used Region instead of Year for now, which should be something the management would want to see anyways.
Meanwhile I lied and could not get the other ones to work... Here is the working expression for NPS numbers, and how can I make this one so that it would be for Completed Year 2016? Thank you!!
(SUM(if([Would Recommend]='Yes',1,0))/COUNT([Would Recommend]) - SUM(if([Would Recommend]='No',1,0))/COUNT([Would Recommend]))*100

- « Previous Replies
-
- 1
- 2
- Next Replies »