Unlock a world of possibilities! Login now and discover the exclusive benefits awaiting you.
- Qlik Community
- :
- Forums
- :
- Analytics
- :
- New to Qlik Analytics
- :
- Re: Sum of value for min date
- Subscribe to RSS Feed
- Mark Topic as New
- Mark Topic as Read
- Float this Topic for Current User
- Bookmark
- Subscribe
- Mute
- Printer Friendly Page
- Mark as New
- Bookmark
- Subscribe
- Mute
- Subscribe to RSS Feed
- Permalink
- Report Inappropriate Content
Sum of value for min date
hi,
on a table I have Date Column and then a value column and also a column with flag
on a table chart, I want to have Date, Min Date, Sum values, Value on Min Date.
I used
Sum(if(Flag = 1 and [Date]= Min(Total <[Date]> [Date]),[Value])) to show value of the minimum date but getting null.
Anyone can help.
Thanks
- « Previous Replies
-
- 1
- 2
- Next Replies »
- Mark as New
- Bookmark
- Subscribe
- Mute
- Subscribe to RSS Feed
- Permalink
- Report Inappropriate Content
can you post the screenshot with some data and also the expression you have used?
- Mark as New
- Bookmark
- Subscribe
- Mute
- Subscribe to RSS Feed
- Permalink
- Report Inappropriate Content
hi,
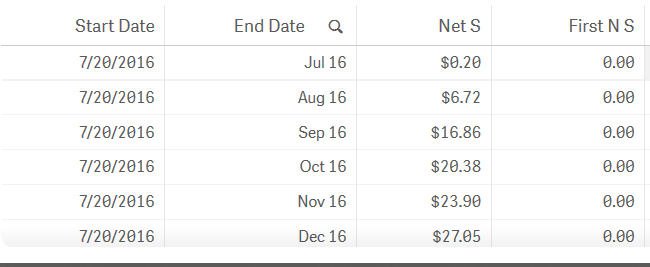
here is a screenshot of my data. the date column I am using is the start date and the column I am working to get done is First N S and the expected value needs to be 0.20 which is the value related to the minimum date.
Please note that the dimension is End Date and the start date is something I came up with using the following expression
if(Flag = 1 , Min(Total <[Date]> [Date]))
and End Date is a dimension with the following in it
date(if(Flag = 1 , [Date]),'MMM YY')
- Mark as New
- Bookmark
- Subscribe
- Mute
- Subscribe to RSS Feed
- Permalink
- Report Inappropriate Content
and to add to it, the following expression returns the value I am expecting
Sum({<Flag = {'1'},[Name]= {'AB'},
[Date]= {'7/20/2016'}
>}
Total <[Date]> [Value])
- Mark as New
- Bookmark
- Subscribe
- Mute
- Subscribe to RSS Feed
- Permalink
- Report Inappropriate Content
I finally got it to work using the following in set analysis
[Date]= {'$(=Min({<Flag= {'1'}, Name= {'AB'}>}Total <[Date]> [Date]))'}
- Mark as New
- Bookmark
- Subscribe
- Mute
- Subscribe to RSS Feed
- Permalink
- Report Inappropriate Content
Steps
dimension:
Date
Expression1:
FieldValue('Date',1)
Expression2:
nets
Expression3:
FieldValue('nets',1)
*Sort the chart by the Date dimension and use the Numeric Value sorting.
- « Previous Replies
-
- 1
- 2
- Next Replies »