Unlock a world of possibilities! Login now and discover the exclusive benefits awaiting you.
- Qlik Community
- :
- Forums
- :
- Analytics
- :
- New to Qlik Analytics
- :
- Table monthly volume with YTD volume
- Subscribe to RSS Feed
- Mark Topic as New
- Mark Topic as Read
- Float this Topic for Current User
- Bookmark
- Subscribe
- Mute
- Printer Friendly Page
- Mark as New
- Bookmark
- Subscribe
- Mute
- Subscribe to RSS Feed
- Permalink
- Report Inappropriate Content
Table monthly volume with YTD volume
Hi,
I have a Qliksense overview of monthly volumes per region.
I have created a table with measure Sum([#Quantity]) per region, but want to add a second column with total volume year to date....
How can I do that?
- Mark as New
- Bookmark
- Subscribe
- Mute
- Subscribe to RSS Feed
- Permalink
- Report Inappropriate Content
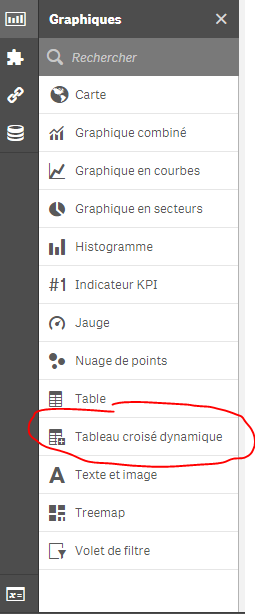
Just choose a dynamic table;
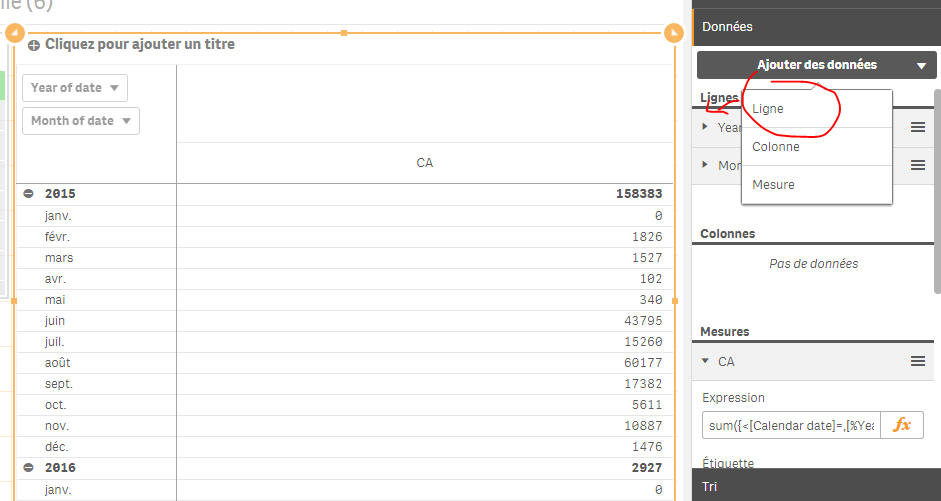
Keep your measure, and add a line 'year":

- Mark as New
- Bookmark
- Subscribe
- Mute
- Subscribe to RSS Feed
- Permalink
- Report Inappropriate Content
thanks, how do you create a dynamic table?
- Mark as New
- Bookmark
- Subscribe
- Mute
- Subscribe to RSS Feed
- Permalink
- Report Inappropriate Content
Youc an just drag it on top of your current table and convert it.
Your simple table will be converted to a dynamic one with the same dimenions/measures.
Then add a line 'year' and put it above your month dimension:
Please, don't forget to mark as helpful the answers that helped you (under actions) and as correct the correct answer to close the thread and thus help the community in search for informations