Unlock a world of possibilities! Login now and discover the exclusive benefits awaiting you.
- Qlik Community
- :
- Forums
- :
- Analytics
- :
- New to Qlik Analytics
- :
- Time aware function demo (not working for me)
- Subscribe to RSS Feed
- Mark Topic as New
- Mark Topic as Read
- Float this Topic for Current User
- Bookmark
- Subscribe
- Mute
- Printer Friendly Page
- Mark as New
- Bookmark
- Subscribe
- Mute
- Subscribe to RSS Feed
- Permalink
- Report Inappropriate Content
Time aware function demo (not working for me)
Hi
I'm replicating Mike Tarallo's video on time aware functionality but won't get same visuals. I know the concept just trying to figure out the step I might be missing (Qlik Sense 3.0 - Time-aware Charts - YouTube ).
I'm using desktop 3.1R3 Qlik Sense for this. I use the excel file attached and follow exact steps. After automatic data preparation :
data model:
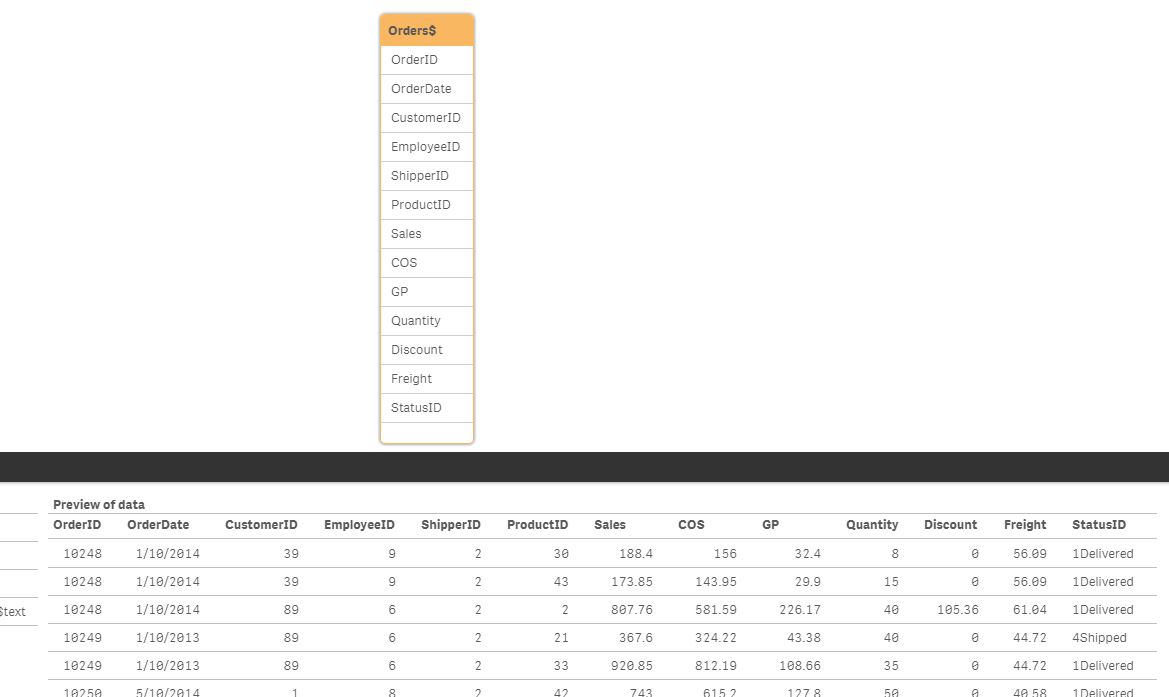
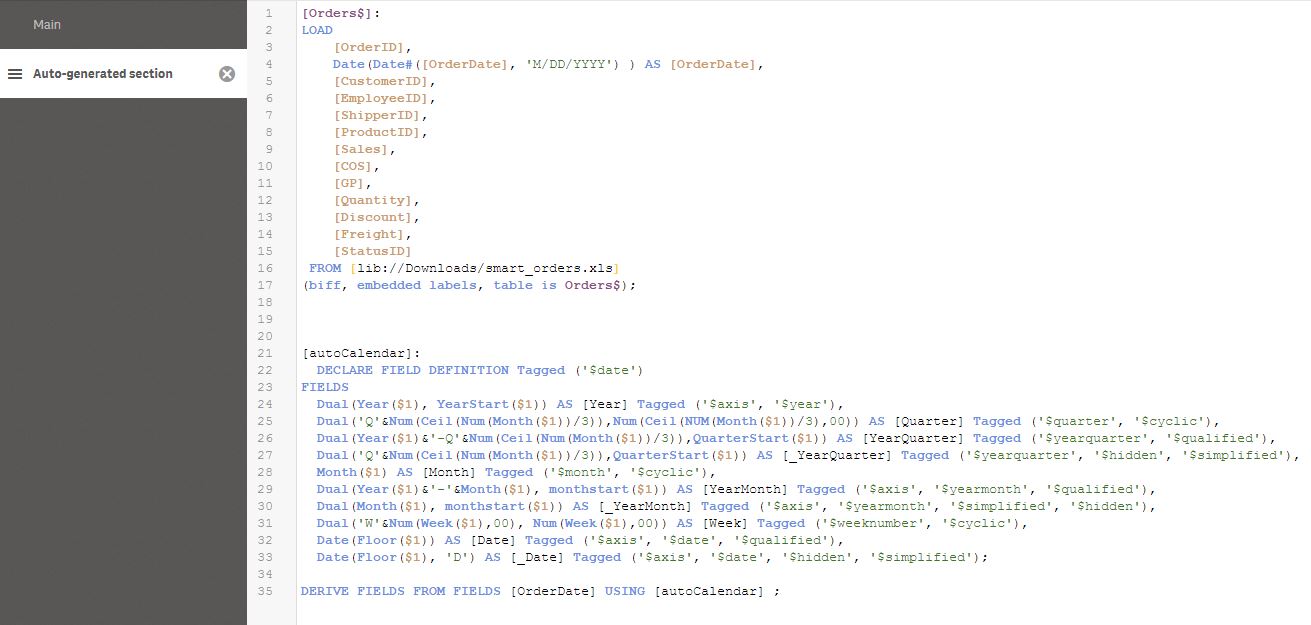
automatically generated load script:
Then I create a line chart with dimension OrderDate above, and measure sum(sales). Note OrderDate and Continuous flag are similar to demo, but generated chart is normal date line.
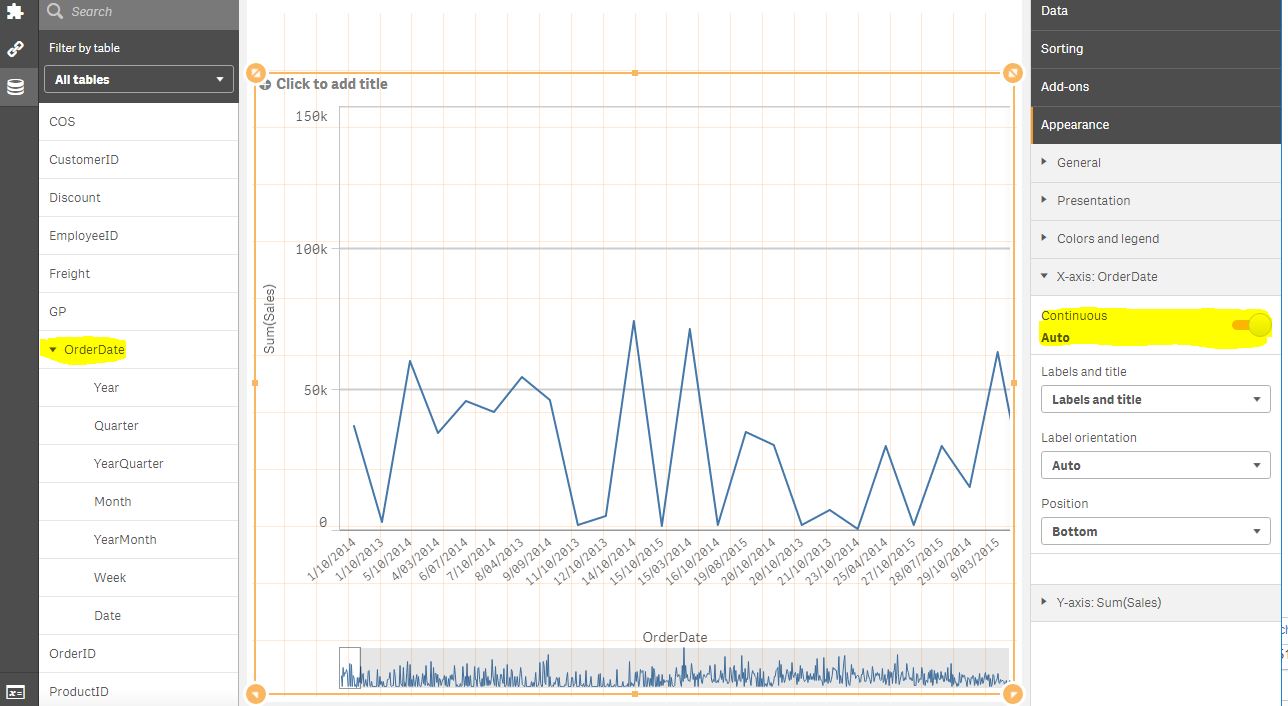
I haven't added or removed anything from steps so just wondering if there is a setting or something that is different on my desktop interface?
Thanks.
Mario
- Tags:
- time-aware charts
Accepted Solutions
- Mark as New
- Bookmark
- Subscribe
- Mute
- Subscribe to RSS Feed
- Permalink
- Report Inappropriate Content
For some reason this tutorial does not work but it is not a crucial issue. I'm going to close this now.
- Mark as New
- Bookmark
- Subscribe
- Mute
- Subscribe to RSS Feed
- Permalink
- Report Inappropriate Content
For some reason this tutorial does not work but it is not a crucial issue. I'm going to close this now.