Unlock a world of possibilities! Login now and discover the exclusive benefits awaiting you.
- Qlik Community
- :
- Forums
- :
- Analytics
- :
- New to Qlik Analytics
- :
- Re: Title Stacked Bar and Period percentage
- Subscribe to RSS Feed
- Mark Topic as New
- Mark Topic as Read
- Float this Topic for Current User
- Bookmark
- Subscribe
- Mute
- Printer Friendly Page
- Mark as New
- Bookmark
- Subscribe
- Mute
- Subscribe to RSS Feed
- Permalink
- Report Inappropriate Content
Title Stacked Bar and Period percentage
Question 1
I want to show a bar chart and by selecting a period (ReportDate) the title of the bar chart need to change with the selecting period.
Example:
ReportDate
20151231
20160131
20160229
20160331
Title:
Credit rating period: 20151231
By selecting the ReportDate 20160131 the title has to change in:
Credit rating period: 20160131
What formula in Qlik Sense can I use?
Question 2
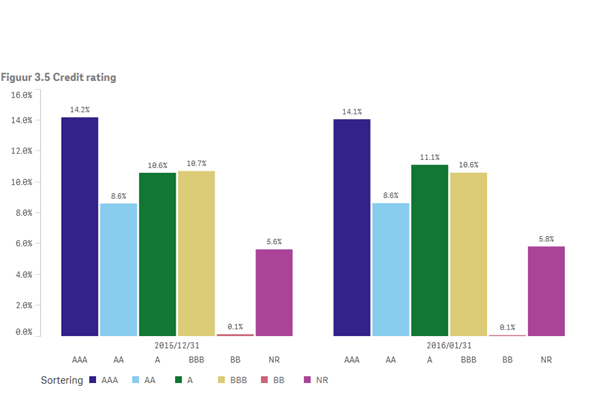
How can I display the percentages of each ReportDate to 100%. Now it is showing for each period the percentage of the total of all the values for the periods 20151231, 20160131.
What formula can I use in Qlik Sense?
- « Previous Replies
-
- 1
- 2
- Next Replies »
- Mark as New
- Bookmark
- Subscribe
- Mute
- Subscribe to RSS Feed
- Permalink
- Report Inappropriate Content
What is the expression you are using currently for calculating %ages? Don't have an answer for your question1 ![]()
- Mark as New
- Bookmark
- Subscribe
- Mute
- Subscribe to RSS Feed
- Permalink
- Report Inappropriate Content
Dear Sunny
Please see the expression I use:
Sum({<ASSET_GROUPING_NAME = {"Fixed Income"}>} MARKET_VALUE_APG_BASE)/Sum (total { <ASSET_GROUPING_NAME = {"Fixed Income"}>} (MARKET_VALUE_APG_BASE))
- Mark as New
- Bookmark
- Subscribe
- Mute
- Subscribe to RSS Feed
- Permalink
- Report Inappropriate Content
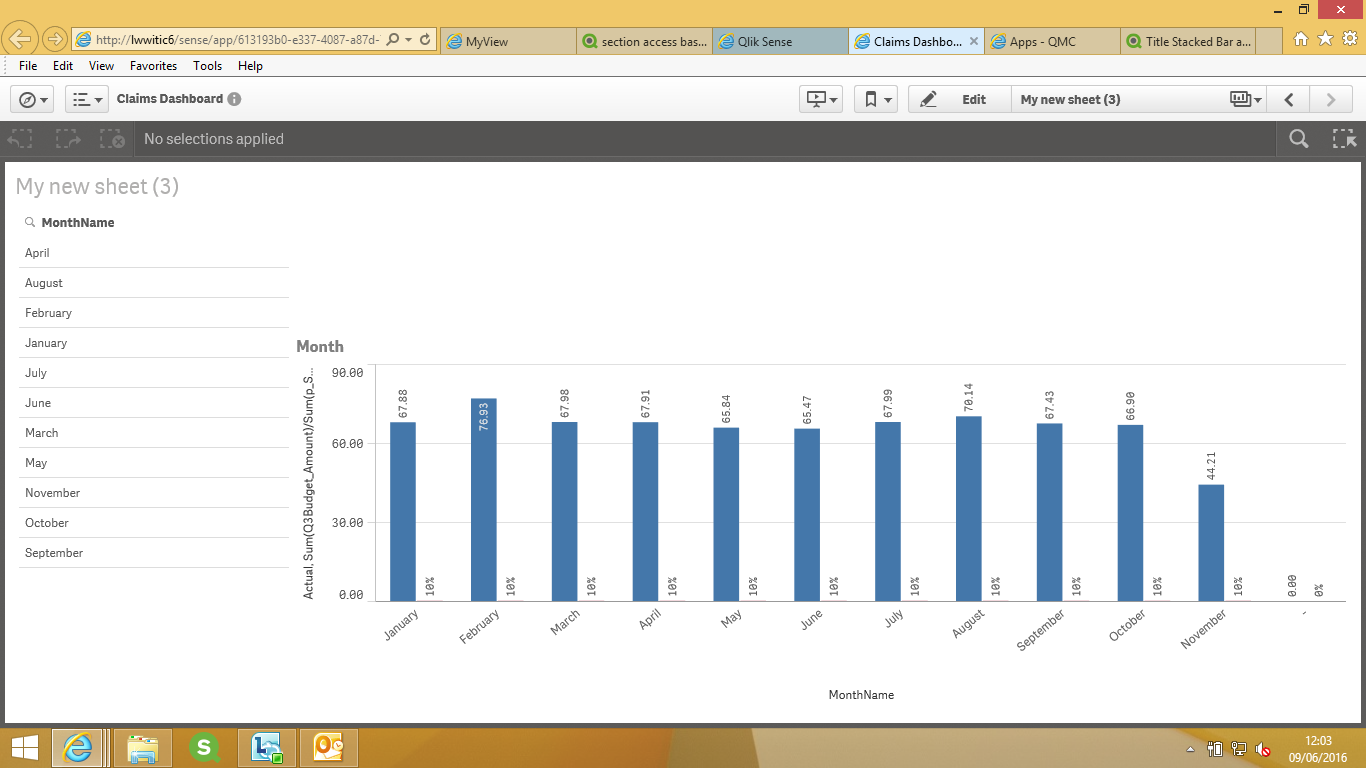
Hi Are you expecting some thing like this first screen shot as it is without filter:
Now I chose month January look at the behaviour and heading of the chart screen shot below:
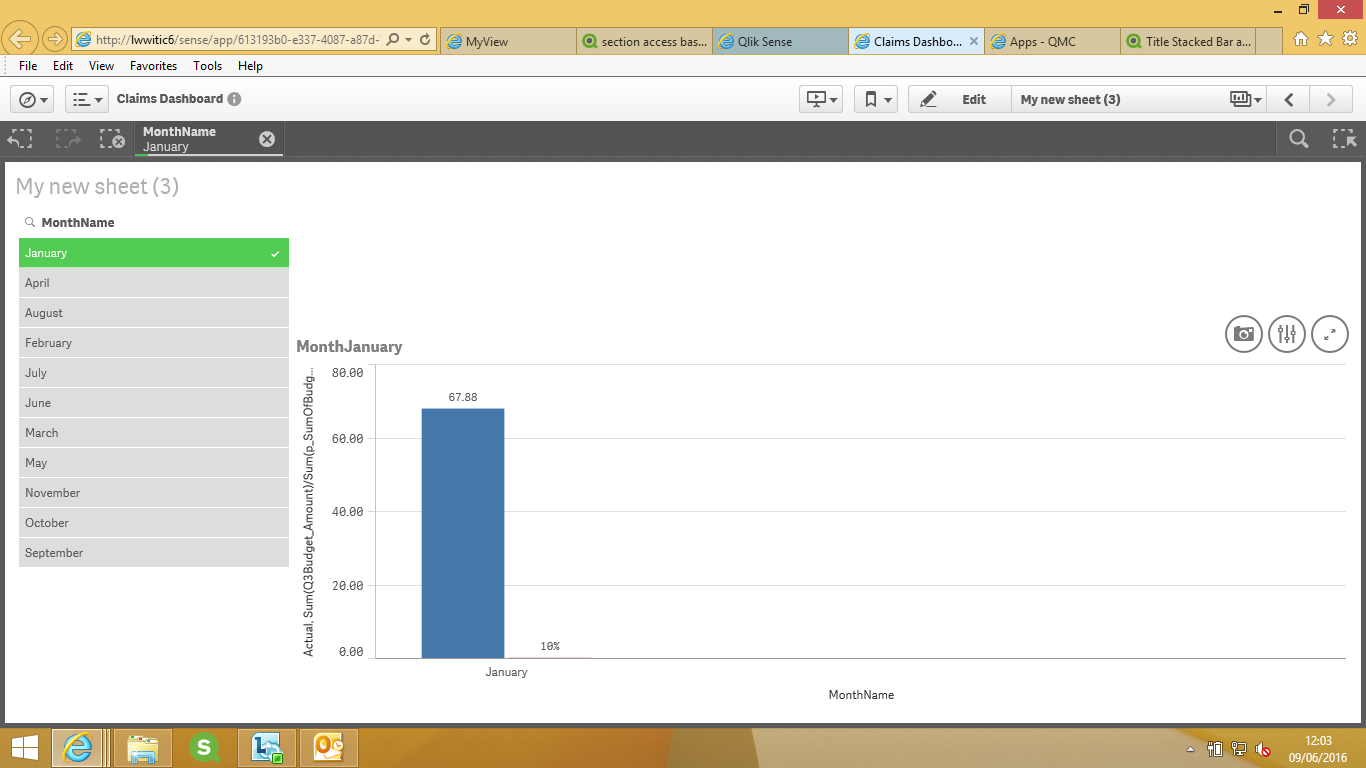
Please let me know if this what you are looking for..
Thanks
- Mark as New
- Bookmark
- Subscribe
- Mute
- Subscribe to RSS Feed
- Permalink
- Report Inappropriate Content
For the title this should be correct. Thanks.
- Mark as New
- Bookmark
- Subscribe
- Mute
- Subscribe to RSS Feed
- Permalink
- Report Inappropriate Content
Try this:
Sum({<ASSET_GROUPING_NAME = {"Fixed Income"}>} MARKET_VALUE_APG_BASE)/Sum (TOTAL <ReportDate> {<ASSET_GROUPING_NAME = {"Fixed Income"}>} (MARKET_VALUE_APG_BASE))
- Mark as New
- Bookmark
- Subscribe
- Mute
- Subscribe to RSS Feed
- Permalink
- Report Inappropriate Content
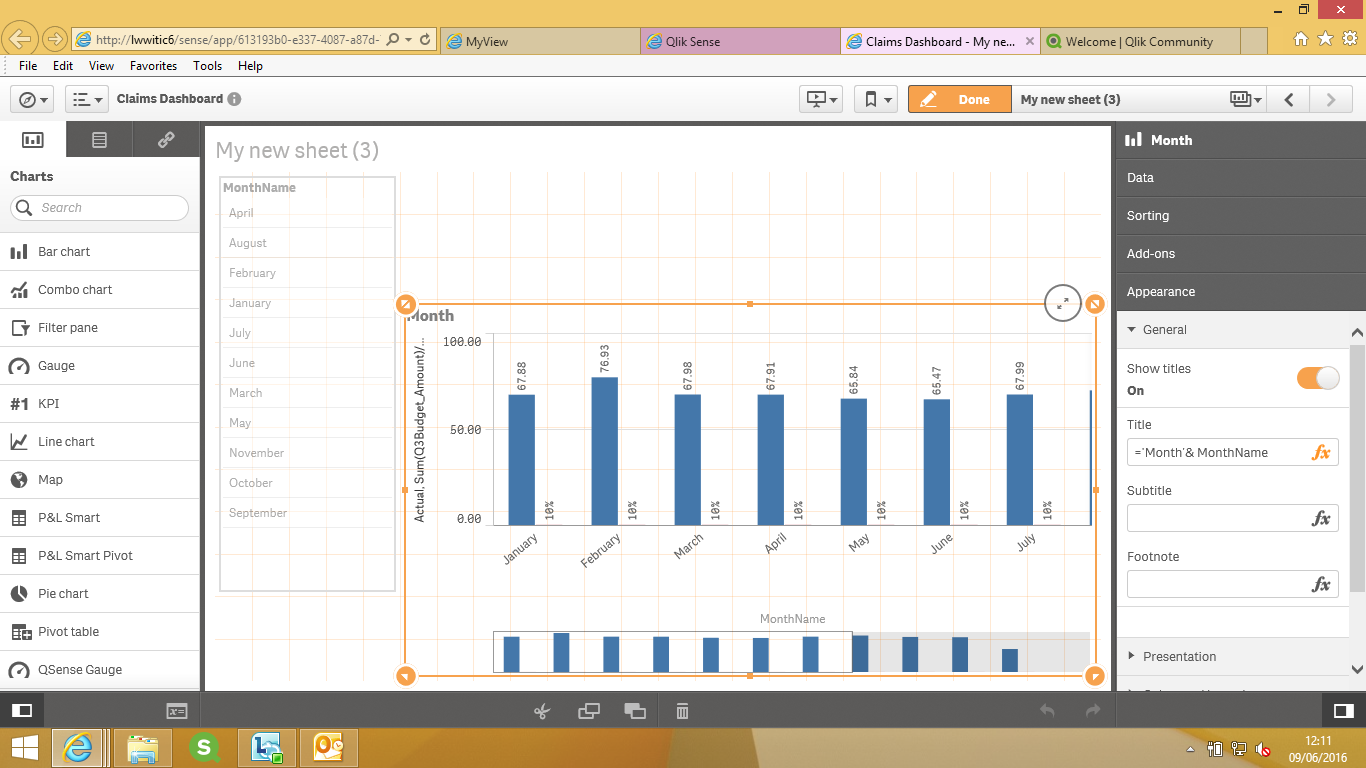
On the right hand side pane there is an option for Appearance and below that title and there you can give expressions for your heading .. I have used ='Month'& MonthName
Thanks
- Mark as New
- Bookmark
- Subscribe
- Mute
- Subscribe to RSS Feed
- Permalink
- Report Inappropriate Content
Dear Sunny
Thanks this works, the only thing I am missing now are the percentages of the different rating classes (AAA,AA,A,BBB,BB).
Best regards
Xandro
- Mark as New
- Bookmark
- Subscribe
- Mute
- Subscribe to RSS Feed
- Permalink
- Report Inappropriate Content
What did it give you? Can you share a screenshot of what you have now?
- Mark as New
- Bookmark
- Subscribe
- Mute
- Subscribe to RSS Feed
- Permalink
- Report Inappropriate Content
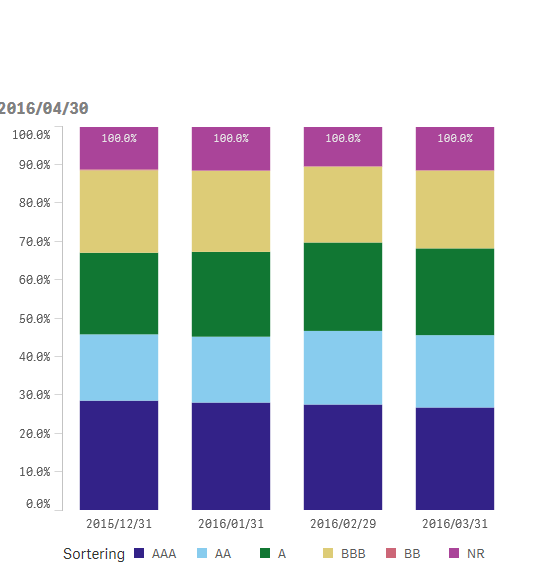
See above
- « Previous Replies
-
- 1
- 2
- Next Replies »