Unlock a world of possibilities! Login now and discover the exclusive benefits awaiting you.
- Qlik Community
- :
- Forums
- :
- Analytics
- :
- New to Qlik Analytics
- :
- Re: To calculate the carry over savings?
- Subscribe to RSS Feed
- Mark Topic as New
- Mark Topic as Read
- Float this Topic for Current User
- Bookmark
- Subscribe
- Mute
- Printer Friendly Page
- Mark as New
- Bookmark
- Subscribe
- Mute
- Subscribe to RSS Feed
- Permalink
- Report Inappropriate Content
To calculate the carry over savings?
Hi all,
Please find the attached excel,
I need to calculate the carryover savings for all the IDs across all the Fiscal years
{ex:
ID MonthYear savings amount
}
and to show same as in stacked bar chart in the attached excel.
Thanks and regards
Prashanth
- Mark as New
- Bookmark
- Subscribe
- Mute
- Subscribe to RSS Feed
- Permalink
- Report Inappropriate Content
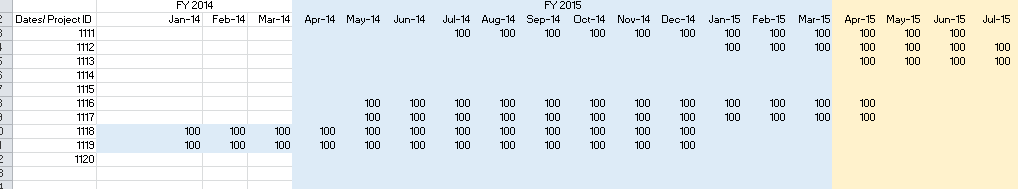
Is this how your data is?
May be convert this data using The Crosstable Load and Gysbert worked on a great example to simplify work for developers when there are more than one pivoted header
https://qlikcommunity.qliktech.com/docs/DOC-4527
See if those help.
Best,
Sunny
- Mark as New
- Bookmark
- Subscribe
- Mute
- Subscribe to RSS Feed
- Permalink
- Report Inappropriate Content
You may need to calculate the opening and closing balance for the year to this
Calculate Opening Balance in Load script
Using Set Analysis to calculate opening & closing balances from a date field selection
Please check this links it might be helpful
Thanks,
Lakshmikandh
- Mark as New
- Bookmark
- Subscribe
- Mute
- Subscribe to RSS Feed
- Permalink
- Report Inappropriate Content
Hi sunny, thanks for the reply.
I need to show two things here:
1. If savings are started for any ID in FY15 and continued in FY16, then FY16 values are carry over to the FY15.
so, in a stacked bar chart, FY15 in one color(blue as shown in excel) and FY16 in orange.
2. All current FY values should be in Blue and all carryover values should be in orange.
regards,
Prashanth