Unlock a world of possibilities! Login now and discover the exclusive benefits awaiting you.
- Qlik Community
- :
- Forums
- :
- Analytics
- :
- New to Qlik Analytics
- :
- Re: Total Row in Line Chart
- Subscribe to RSS Feed
- Mark Topic as New
- Mark Topic as Read
- Float this Topic for Current User
- Bookmark
- Subscribe
- Mute
- Printer Friendly Page
- Mark as New
- Bookmark
- Subscribe
- Mute
- Subscribe to RSS Feed
- Permalink
- Report Inappropriate Content
Total Row in Line Chart
Hi, I'm new to Qlik Sense so forgive me if this has been asked.
I have a line chart with Term Code and Gender as my Dimensions and Count(Enrollment) as my Measure. I have two lines in my Line Chart 1 for Females and 1 for Males. I would like a 3rd line that has the total of both the Male and the Female Enrollment. I've reviewed some videos and gather that it is a calculation but I'm not doing something right.
Any help would be greatly appreciated.
- Mark as New
- Bookmark
- Subscribe
- Mute
- Subscribe to RSS Feed
- Permalink
- Report Inappropriate Content
Instead of Gender dimension, you could use a synthethic dimension
=ValueList( 'Female', 'Male', 'Total')
Then your expressions would look like
=Pick(Match(ValueList( 'Female', 'Male', 'Total'),'Female', 'Male', 'Total'),
Count({<Gender = {'Female'}>} Enrollment),
Count({<Gender = {'Male'}>} Enrollment),
Count(Enrollment)
)
- Mark as New
- Bookmark
- Subscribe
- Mute
- Subscribe to RSS Feed
- Permalink
- Report Inappropriate Content
Hi,
You can also do this by using an Inline table like below
LOAD
*
INLINE[
Gender, Gender_WITH_TOTAL
Female, Female
Male, Male
Female, Total
Male, Total];
Now use Gender_WITH_TOTAL as a dimension, now you can use this in all your charts wherever you required.
Expression:
Count(Enrollment)
Hope this helps you.
Regards,
jagan.
- Mark as New
- Bookmark
- Subscribe
- Mute
- Subscribe to RSS Feed
- Permalink
- Report Inappropriate Content
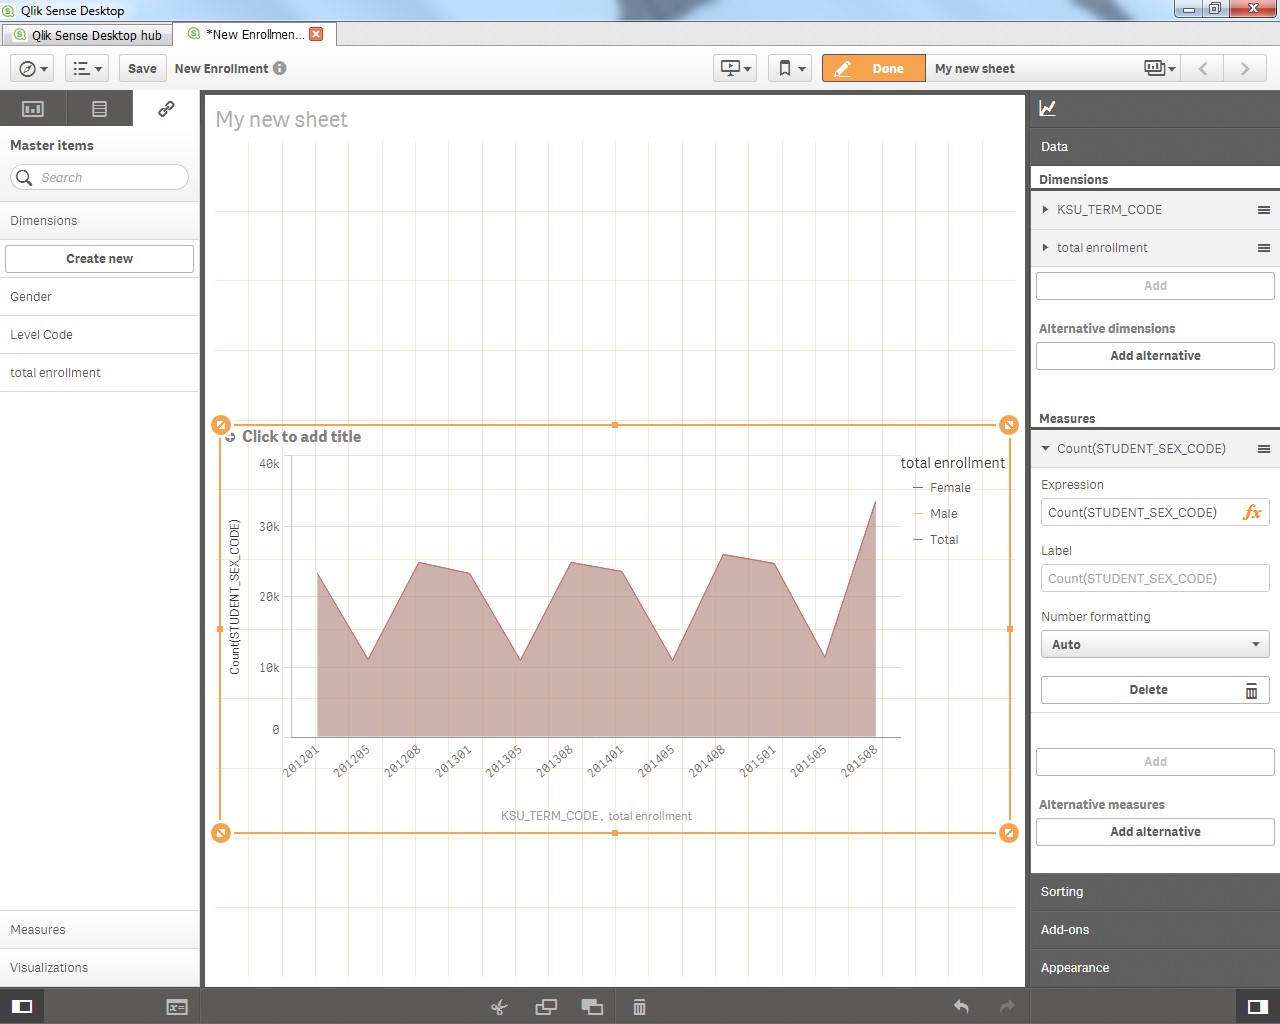
When I create the synthethic dimension and use it I loose the individual lines for Male and Female and it changes the graph to just the total but I see entries in the legend for Male, Female and Total. Not sure what I'm doing wrong.
- Mark as New
- Bookmark
- Subscribe
- Mute
- Subscribe to RSS Feed
- Permalink
- Report Inappropriate Content
Hi
I saw your picture from your graph
i think you miss something
Keep dimension KSU_TERM_CODE
check that dimension total enrollment is made with this formula :
ValueList( 'Female', 'Male', 'Total')
and remove the mesure count(STUDENT_SEX_CODE) and replace it by this one :
=Pick(Match(ValueList( 'Female', 'Male', 'Total'),'Female', 'Male', 'Total'),
Count({<Gender = {'Female'}>} Enrollment),
Count({<Gender = {'Male'}>} Enrollment),
Count(Enrollment)
)
regards
- Mark as New
- Bookmark
- Subscribe
- Mute
- Subscribe to RSS Feed
- Permalink
- Report Inappropriate Content
HI,
Try like this, I think ValueList() won't work with Pick() & Match()
=If(ValueList( 'Female', 'Male', 'Total')='Female',
Count({<Gender = {'Female'}>} Enrollment),'Male', 'Total'),
If(ValueList('Female', 'Male', 'Total')='Male',
Count({<Gender = {'Male'}>} Enrollment),
Count(Enrollment)
))
Hope this helps you.
Regards,
Jagan.
- Mark as New
- Bookmark
- Subscribe
- Mute
- Subscribe to RSS Feed
- Permalink
- Report Inappropriate Content
Use only Term Code as dimension and three expressions:
Female: Count({<Gender={'Female'}>}Enrollment)
Male: Count({<Gender={'Male'}>}Enrollment)
Total: Count(Enrollment)
For clarity I'd choose Line as Presentation instead of Area.
If you don't see the Female and Male lines then the set expression is probably returning an empty set. Make sure to use exact case sensitive field names and values. Female, FEMALE and female are three different values. Gender, GENDER and gender are three different fields.
talk is cheap, supply exceeds demand