Unlock a world of possibilities! Login now and discover the exclusive benefits awaiting you.
Announcements
Accelerate Your Success: Fuel your data and AI journey with the right services, delivered by our experts.
Learn More
- Qlik Community
- :
- Forums
- :
- Analytics
- :
- New to Qlik Analytics
- :
- Re: Transpose a table
Options
- Subscribe to RSS Feed
- Mark Topic as New
- Mark Topic as Read
- Float this Topic for Current User
- Bookmark
- Subscribe
- Mute
- Printer Friendly Page
Turn on suggestions
Auto-suggest helps you quickly narrow down your search results by suggesting possible matches as you type.
Showing results for
Contributor
2017-12-04
11:28 AM
- Mark as New
- Bookmark
- Subscribe
- Mute
- Subscribe to RSS Feed
- Permalink
- Report Inappropriate Content
Transpose a table
this might be easy and i am still new to qlik.
My table in the database looks like this:
| product | year | sales |
| product1 | 2014 | 10 |
| product2 | 2014 | 20 |
| product3 | 2014 | 30 |
| product1 | 2015 | 110 |
| product2 | 2015 | 120 |
| product3 | 2015 | 130 |
| product1 | 2016 | 210 |
| product2 | 2016 | 220 |
| product3 | 2016 | 230 |
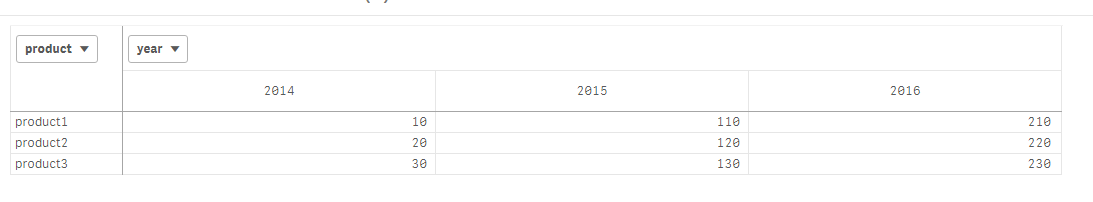
I am trying to use qlik sense to display data in the following format:
| product | 2014 | 2015 | 2016 |
| product1 | 10 | 110 | 210 |
| product2 | 20 | 120 | 220 |
| product3 | 30 | 130 | 230 |
For each year column, i have tried =if(Year = '2014', Product, null()), but this is not working.
Much appreciated.
Thanks and regards,
Ra
900 Views
1 Reply
MVP
2017-12-04
11:33 AM
- Mark as New
- Bookmark
- Subscribe
- Mute
- Subscribe to RSS Feed
- Permalink
- Report Inappropriate Content
create a pivot table:
a dimension : product
as colum: Year
as measure : sum(Sales)
Community Browser