Unlock a world of possibilities! Login now and discover the exclusive benefits awaiting you.
- Qlik Community
- :
- Forums
- :
- Analytics
- :
- New to Qlik Analytics
- :
- Trouble indexing in Qlik Sense
- Subscribe to RSS Feed
- Mark Topic as New
- Mark Topic as Read
- Float this Topic for Current User
- Bookmark
- Subscribe
- Mute
- Printer Friendly Page
- Mark as New
- Bookmark
- Subscribe
- Mute
- Subscribe to RSS Feed
- Permalink
- Report Inappropriate Content
Trouble indexing in Qlik Sense
Hey guys,
I have a line graph with 2 dimenions and a measure.
MonthYear, (x-axis)
Commodity,
Price (measure)
And unfortunately I have a couple problems which I'll break down
1. Set analysis
Thanks to this blog I've sort of got an indexing formula sorted which is
sum(Price)/(sum( total <Commodity> if(month(Date(MonthYear))=month(min(total Date(MonthYear))),Price))/100)
However I am trying to use set analysis of it so only Category 1 commodities are included. I know how to include it in the first Sum() just fine (ie. {$<Category = {1}>}), but I'm unsure about the second Sum().
2. MonthYear
I am unsure if I have included MonthYear correctly into the formula. MonthYear is loaded as:
Date(monthstart(TempDate), 'MMM-YY') AS MonthYear
I ask if this is correct because I am experiencing issues with the MonthYear dimension in my line chart.
My table has 4 fields. Date, Commodity, Price, Volume.
Volume has dates stemming back to Sep 12 while Price only has values starting Jan 14. However when I have the formula in, my indexation starts from Sep 12, while I want it to start at Jan 14 because that's when I first have data. The rest is blank.
I've tried using Limitation to > 0, but that's not working either. Instead it starts from Sep 12 and ends up looking like this.
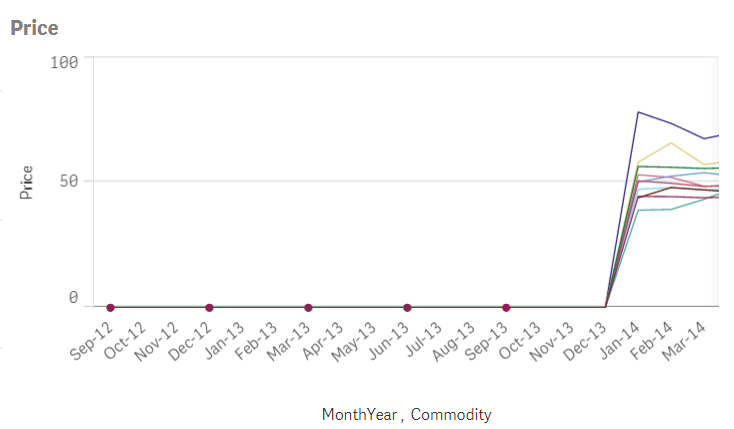
When I select the months which have Price data, which is Jan-14 to Jan-15, it still doesn't work.
But when select the 2014 year, it works perfectly.
Does anyone know how to fix these issues?
Thanks in advance for your help!
- Mark as New
- Bookmark
- Subscribe
- Mute
- Subscribe to RSS Feed
- Permalink
- Report Inappropriate Content
Hey guys,
Apologies for bumping this question back up, but would anyone know how to do this?
- Mark as New
- Bookmark
- Subscribe
- Mute
- Subscribe to RSS Feed
- Permalink
- Report Inappropriate Content
Your first question - to add the Category set filter:
sum({<Category = {1}>} Price) / (sum({<Category = {1}>} total <Commodity> if(MonthYear = min(total MonthYear)), Price) / 100)
But you could also remove the If() clause:
sum({<Category = {1}>} Price) / (sum({<Category = {1}, MonthYear = {"$(=min(MonthYear))"}>} total <Commodity> Price) / 100)
If that does not work, you may need this version:
sum({<Category = {1}>} Price) / (sum({<Category = {1}, MonthYear = {"$(=Date(min(MonthYear))"}>} total <Commodity> Price) / 100)
- Mark as New
- Bookmark
- Subscribe
- Mute
- Subscribe to RSS Feed
- Permalink
- Report Inappropriate Content
For your second question - is Price null or zero before Jan 2014? If its null, then
min({<Price>} MonthYear)
will return the first month with a non-null Price. If is is zero, then
min({<Price -= {0}>} MonthYear)
will return the first month with a non-zero price (actually the first non-zero AND non-null value). The -= may show as a syntax error (it does in Qlikview) but that is a bug in the QV expression editor.
- Mark as New
- Bookmark
- Subscribe
- Mute
- Subscribe to RSS Feed
- Permalink
- Report Inappropriate Content
Hey Jonathan, thanks for your reply.
In your first post, the second equation worked for me perfectly in regards to the set analysis so thank you!
The price before Jan 2014 is null so I inputted the part in your second post to formulate this:
sum({<Category = {1}>} Price) / (sum({<Category = {1}, MonthYear = {"$(=min({<Price>} MonthYear))"}>} total <Commodity> Price) / 100)
But as a precaution to any zero's in my data (there is no reason for the price to be zero) I changed the equation to:
sum({<Category = {1}>} Price) / (sum({<Category = {1}, MonthYear = {"$(=min({<Price -= {0}>} MonthYear))"}>} total <Commodity> Price) / 100)
And it has no syntax error.
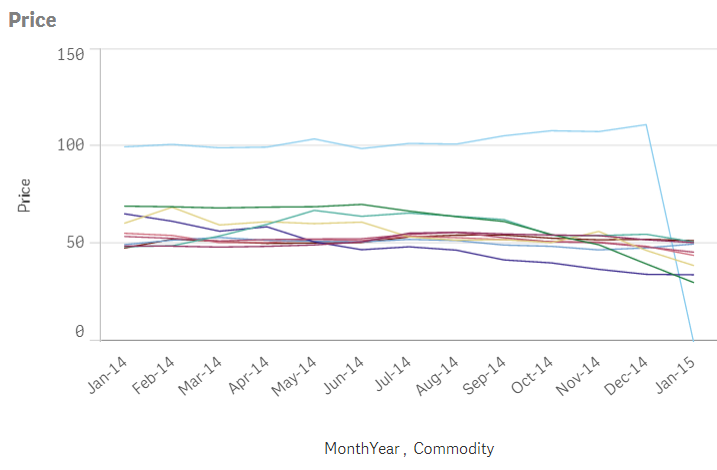
This is nearly working, however I'm experiencing a couple problems. By default instead of the Min MonthYear being Jan 14 it is Sep 12, I'm not able to select the MonthYears on the line chart by clicking on it or drag selecting, and no data is actually shown on the chart. But I can select the years 2014 and 2015 in a filter pane and the chart works perfectly with the data showing from Jan 14 to Jan 15, and it then allows me to select the MonthYear on the chart.
Hopefully there's a way to fix these problems. Your help is very much greatly appreciated! 
Edit:
I just realised that I'm experiencing another issue.
I'm not able to click on the commodity in the legend, and more than the specified number appears. Category 1 only contains 4 different commodities, and only 4 show on the chart, but all commodities show up in the legend (about 12). I'm also not able to click on the commodities, just the same as the MonthYear. However when I click on 1 in the Category filter pane, it seems to work fine.
- Mark as New
- Bookmark
- Subscribe
- Mute
- Subscribe to RSS Feed
- Permalink
- Report Inappropriate Content
Hey guys, just an update to this thread. I've decided to just chuck in the figures dating back to Sept 12 so now it seems to be working alright. However I'm still experiencing a couple issues.
I'm not able to click on a single MonthYear on the x-axis. It just doesn't seem to work. And Even though I've specified to only shopw 4 commodities, on the legend every commodity is shwon (as you can see by the different colours in the legend in the below pic).
Does anyone know how to fix those 2 issues? If the commodity issue can't be fixed I'll just chuck the ones I need in a new field as my second dimension and remove the set analysis.