Unlock a world of possibilities! Login now and discover the exclusive benefits awaiting you.
- Qlik Community
- :
- Forums
- :
- Analytics
- :
- New to Qlik Analytics
- :
- Re: Trying to create a vertical reference line on ...
- Subscribe to RSS Feed
- Mark Topic as New
- Mark Topic as Read
- Float this Topic for Current User
- Bookmark
- Subscribe
- Mute
- Printer Friendly Page
- Mark as New
- Bookmark
- Subscribe
- Mute
- Subscribe to RSS Feed
- Permalink
- Report Inappropriate Content
Trying to create a vertical reference line on a histogram
I am trying to create vertical line on a histogram that shows the price of a product in increments of $5 on the x axis and the number of that product sold on the y axis. I want to create a vertical reference line showing the median. I have not found a discussion post that has an answer on how to do that.
Accepted Solutions
- Mark as New
- Bookmark
- Subscribe
- Mute
- Subscribe to RSS Feed
- Permalink
- Report Inappropriate Content
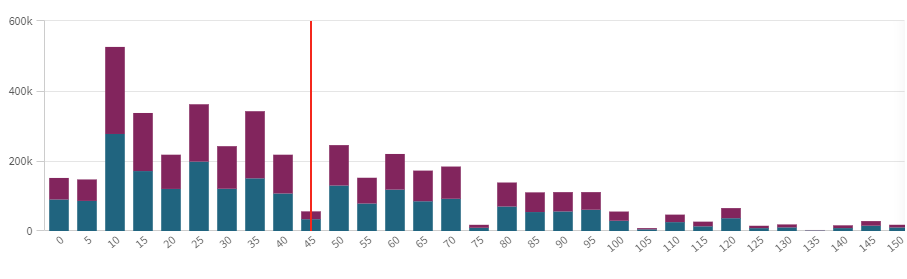
Hi, I ended up finding a way to do it. This is a bar chart, not a histogram but it still fit what I was trying to do. Its called Dimension reference lines.
.png)
- Mark as New
- Bookmark
- Subscribe
- Mute
- Subscribe to RSS Feed
- Permalink
- Report Inappropriate Content
Hello @ammarahw
Maybe a Combined Chart will help you in this use case?
https://help.qlik.com/en-US/sense/February2024/Subsystems/Hub/Content/Sense_Hub/Visualizations/Combo...
- Mark as New
- Bookmark
- Subscribe
- Mute
- Subscribe to RSS Feed
- Permalink
- Report Inappropriate Content
Thank you for replying. I tried the combi chart that but wasn't able to use the the combined chart to make one solid vertical line. I was only able to create a horizontal line. It looks like someone in the past has suggested a vertical reference line.
Do you know if there is a way to check on what happened with this? https://community.qlik.com/t5/App-Development/Vertical-Reference-Line-in-Histogram/td-p/1450959
- Mark as New
- Bookmark
- Subscribe
- Mute
- Subscribe to RSS Feed
- Permalink
- Report Inappropriate Content
Hi, I ended up finding a way to do it. This is a bar chart, not a histogram but it still fit what I was trying to do. Its called Dimension reference lines.