Unlock a world of possibilities! Login now and discover the exclusive benefits awaiting you.
- Qlik Community
- :
- Forums
- :
- Analytics
- :
- New to Qlik Analytics
- :
- Re: Values are Multiplying
- Subscribe to RSS Feed
- Mark Topic as New
- Mark Topic as Read
- Float this Topic for Current User
- Bookmark
- Subscribe
- Mute
- Printer Friendly Page
- Mark as New
- Bookmark
- Subscribe
- Mute
- Subscribe to RSS Feed
- Permalink
- Report Inappropriate Content
Values are Multiplying
So the way my data is structured i had to do a couple of joins. Now the way that the data is coming in, depending on how many attributes each program has, the value is multiplied by that. ex 2 attributes multiplied by 2, 3 attributes multipied by 3. etc. How do I fix this?
Thanks! I have included the load statement! and attatched the data I am using.
LOAD
Program,
Product,
CTA as "Attributes",
"Bias Spring",
"Internal bearing",
"External bearing",
"Backlash Set & Measure",
"# Vane seals",
"# Bolts",
RU,
"Equipment Type",
"Gold Tag #",
Status,
"PO timing",
Supplier,
"# Models",
"# Operators",
"Cycle Time (s)",
"Theoretical OEE (%)",
"Sourced Price",
"Machine capacity",
"Labor cost/unit",
"Capital cost/unit",
"Total cost/unit",
"Lead Time (wks)",
"Warranty (mon)",
"Payment Terms",
"Delivery Terms",
Comments
FROM [lib://VCT Capital Data/2017_02_02_Assembly Lines Benchmarking_MB.xlsx]
(ooxml, embedded labels, table is [VCT (2)])
where CTA = 'CTA';
join
LOAD
Program,
Product,
TA as "Attributes",
"Bias Spring",
"Internal bearing",
"External bearing",
"Backlash Set & Measure",
"# Vane seals",
"# Bolts",
RU,
"Equipment Type",
"Gold Tag #",
Status,
"PO timing",
Supplier,
"# Models",
"# Operators",
"Cycle Time (s)",
"Theoretical OEE (%)",
"Sourced Price",
"Machine capacity",
"Labor cost/unit",
"Capital cost/unit",
"Total cost/unit",
"Lead Time (wks)",
"Warranty (mon)",
"Payment Terms",
"Delivery Terms",
Comments
FROM [lib://VCT Capital Data/2017_02_02_Assembly Lines Benchmarking_MB.xlsx]
(ooxml, embedded labels, table is [VCT (2)])
Where TA = 'TA';
Join
LOAD
Program,
Product,
OPA as "Attributes",
"Bias Spring",
"Internal bearing",
"External bearing",
"Backlash Set & Measure",
"# Vane seals",
"# Bolts",
RU,
"Equipment Type",
"Gold Tag #",
Status,
"PO timing",
Supplier,
"# Models",
"# Operators",
"Cycle Time (s)",
"Theoretical OEE (%)",
"Sourced Price",
"Machine capacity",
"Labor cost/unit",
"Capital cost/unit",
"Total cost/unit",
"Lead Time (wks)",
"Warranty (mon)",
"Payment Terms",
"Delivery Terms",
Comments
FROM [lib://VCT Capital Data/2017_02_02_Assembly Lines Benchmarking_MB.xlsx]
(ooxml, embedded labels, table is [VCT (2)])
Where OPA = 'OPA';
join
LOAD
Program,
Product,
MPL as "Attributes",
"Bias Spring",
"Internal bearing",
"External bearing",
"Backlash Set & Measure",
"# Vane seals",
"# Bolts",
RU,
"Equipment Type",
"Gold Tag #",
Status,
"PO timing",
Supplier,
"# Models",
"# Operators",
"Cycle Time (s)",
"Theoretical OEE (%)",
"Sourced Price",
"Machine capacity",
"Labor cost/unit",
"Capital cost/unit",
"Total cost/unit",
"Lead Time (wks)",
"Warranty (mon)",
"Payment Terms",
"Delivery Terms",
Comments
FROM [lib://VCT Capital Data/2017_02_02_Assembly Lines Benchmarking_MB.xlsx]
(ooxml, embedded labels, table is [VCT (2)])
Where MPL = 'MPL';
Join
LOAD
Program,
Product,
EOL as "Attributes",
"Bias Spring",
"Internal bearing",
"External bearing",
"Backlash Set & Measure",
"# Vane seals",
"# Bolts",
RU,
"Equipment Type",
"Gold Tag #",
Status,
"PO timing",
Supplier,
"# Models",
"# Operators",
"Cycle Time (s)",
"Theoretical OEE (%)",
"Sourced Price",
"Machine capacity",
"Labor cost/unit",
"Capital cost/unit",
"Total cost/unit",
"Lead Time (wks)",
"Warranty (mon)",
"Payment Terms",
"Delivery Terms",
Comments
FROM [lib://VCT Capital Data/2017_02_02_Assembly Lines Benchmarking_MB.xlsx]
(ooxml, embedded labels, table is [VCT (2)])
Where EOL = 'EOL';
- « Previous Replies
-
- 1
- 2
- Next Replies »
Accepted Solutions
- Mark as New
- Bookmark
- Subscribe
- Mute
- Subscribe to RSS Feed
- Permalink
- Report Inappropriate Content
Perhaps just load the main table as is, but without the attributes columns. So no joining or concatenating. And then create a separate Attributes table with the program and product fields and the attributes. That second table can be created with a CrossTable load:
Attributes:
CrossTable(Attribute, Value,2)
LOAD
Program,
Product,
CTA,
TA,
OPA,
MPL,
EOL
FROM
[LIB://VCT Capital Data/2017_02_02_Assembly Lines Benchmarking_MB.xlsx]
(ooxml, embedded labels, table is [VCT (2)])
;
This will create a synthetic key because the fields Program and Product will exist in both tables. This synthetic key is not a problem and does not need to be removed. But if you want you can create a new key field in both tables based on the Program and Product fields, i.e. autonumber(Program & '|' & Product) as NewKeyField, and use that new key field to associate the two tables. You can then drop the Program and Product fields from for example the new Attributes table.
talk is cheap, supply exceeds demand
- Mark as New
- Bookmark
- Subscribe
- Mute
- Subscribe to RSS Feed
- Permalink
- Report Inappropriate Content
Hi Ariana,
Are you using Qlik Sense or QlikView - I assume Qlik Sense as I see it in the tags section. I will move this thread to the appropriate section so it will get more visibility - right now it is posted in Qlik Data Market.
Thanks for attaching your data - are you new to Qlik products? The reason I ask, is I see you are joining in the script - and technically that does not need to be done with Qlik unless you are creating a specific a data model that will loaded to a file on disk - that is then loaded to a Qlik app.
Qlik will automatically associate columns with the same name (like ID fields etc) - there is no need to explicitly join under normal circumstances.
I see the data is in a crosstab format - let me play with it and I'll see if I can create a sample for you. Since I see most of the format of the data is the same - we should be able to concatenate and combine all the sheets into 1 table.
I'll take a look and let you know.
When applicable please mark the appropriate replies as CORRECT. This will help community members and Qlik Employees know which discussions have already been addressed and have a possible known solution. Please mark threads as HELPFUL if the provided solution is helpful to the problem, but does not necessarily solve the indicated problem. You can mark multiple threads as HELPFUL if you feel additional info is useful to others.
Regards,
Michael Tarallo (@mtarallo) | Twitter
Qlik
Mike Tarallo
Qlik
- Mark as New
- Bookmark
- Subscribe
- Mute
- Subscribe to RSS Feed
- Permalink
- Report Inappropriate Content
Thank you! That would be a lot of help! Yes we are using Qlik Sense. We have been using it for over a year, but this is the first time I have come across data like this.
Thanks
Ariana Ford
- Mark as New
- Bookmark
- Subscribe
- Mute
- Subscribe to RSS Feed
- Permalink
- Report Inappropriate Content
Hi Ariann,
I took your script and removed the join syntax and got a simple table that concatenated all the values automatically.
Is this what you are looking for?
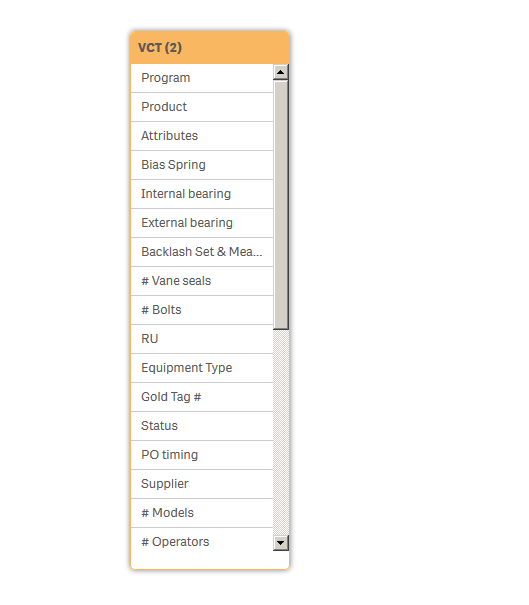
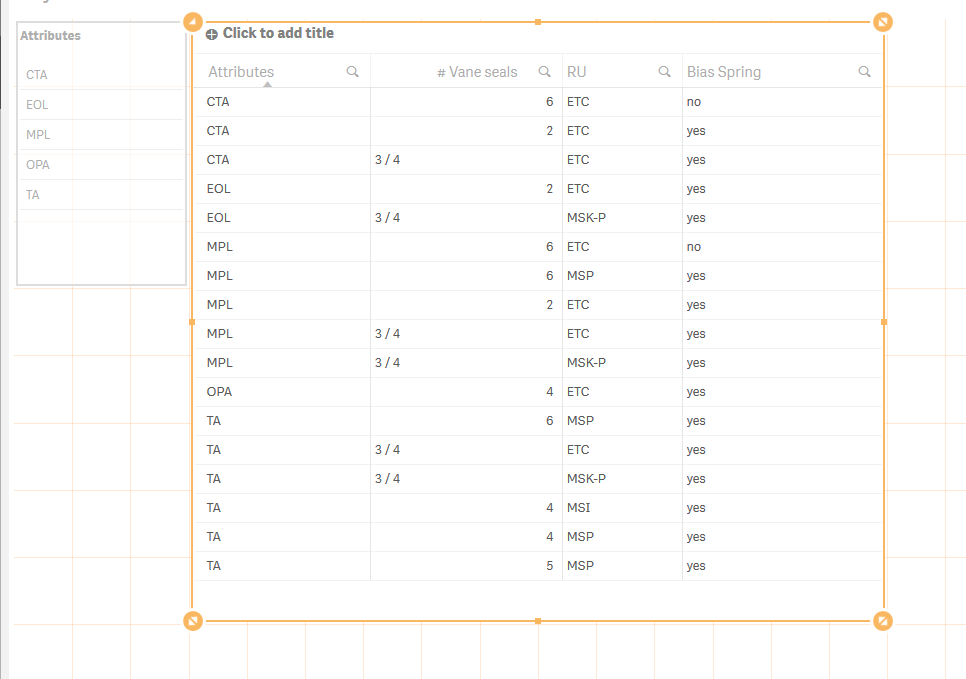
I check against the excel data - it seems to match up.
Note in my table properties: - I unchecked Include null values:

or you get this:
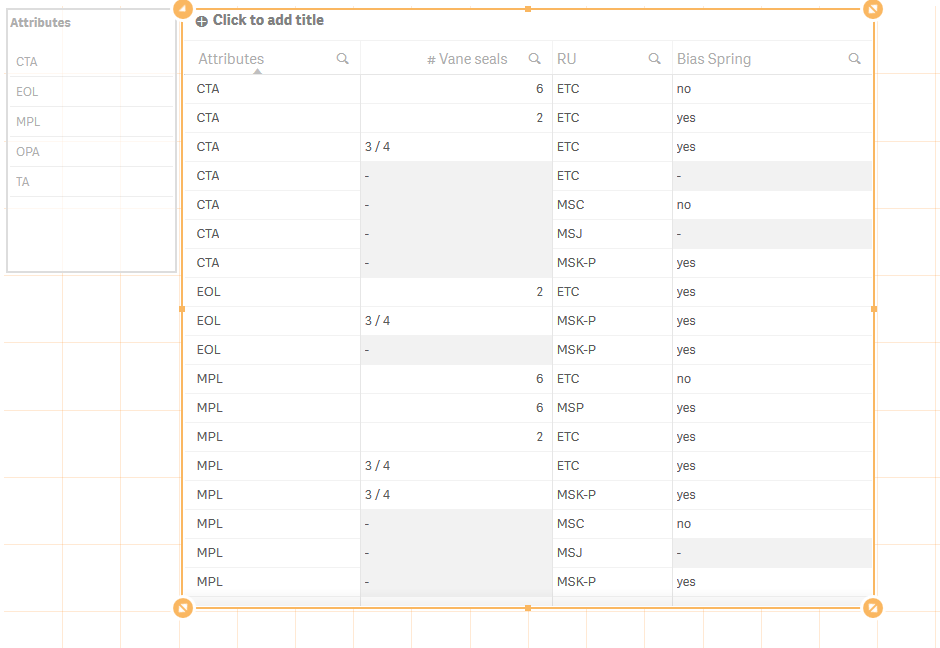
let me know how you do.
If using Qlik Sense Desktop please copy .qvf file to your C:\Users\<user profile>\Documents\Qlik\Sense\Apps and refresh Qlik Sense Desktop with F5. If using Qlik Sense Enterprise Server please import .qvf into your apps using the QMC - Qlik Management Console.
When applicable please mark the appropriate replies as CORRECT. This will help community members and Qlik Employees know which discussions have already been addressed and have a possible known solution. Please mark threads as HELPFUL if the provided solution is helpful to the problem, but does not necessarily solve the indicated problem. You can mark multiple threads as HELPFUL if you feel additional info is useful to others.
Regards,
Michael Tarallo (@mtarallo) | Twitter
Qlik
Mike Tarallo
Qlik
- Mark as New
- Bookmark
- Subscribe
- Mute
- Subscribe to RSS Feed
- Permalink
- Report Inappropriate Content
The values are still occuring multiple times. Like pentastar equa;s 7.24 when it really should equal 3.62 if the values weren’t multiplying by the number of attributes it has.
Ariana
- Mark as New
- Bookmark
- Subscribe
- Mute
- Subscribe to RSS Feed
- Permalink
- Report Inappropriate Content
Hi Ariana - can you provide some screen shots of what you are seeing?
For which measure do you see pentastar = 7.24?
I understand what you are saying but need to see it on my side.
Thanks
Mike Tarallo
Qlik
- Mark as New
- Bookmark
- Subscribe
- Mute
- Subscribe to RSS Feed
- Permalink
- Report Inappropriate Content
This is what I am seeing
I am using the sum of sourced price as a measure and program as the dimension
- Mark as New
- Bookmark
- Subscribe
- Mute
- Subscribe to RSS Feed
- Permalink
- Report Inappropriate Content
Ah ok - I thought so - now I see - to make a long story short - this data is not in an ideal format for reporting, but we could still make it work for you with Qlik Sense.
This is because you have Pentastar MLP and Pentastar CTA - so the way the product is working and the way the data is loading - what you see is technically correct - as the data value for sourced price is being aggregated for each attribute value (MLP and CTA) However, I understand that is not what you want, so we need to see how to get the data in the proper format, or perhaps use a SET expression to only include the attribute we want
In short in the data there needs to be a distinction between these attributes - because right now they represent the same sourced price.
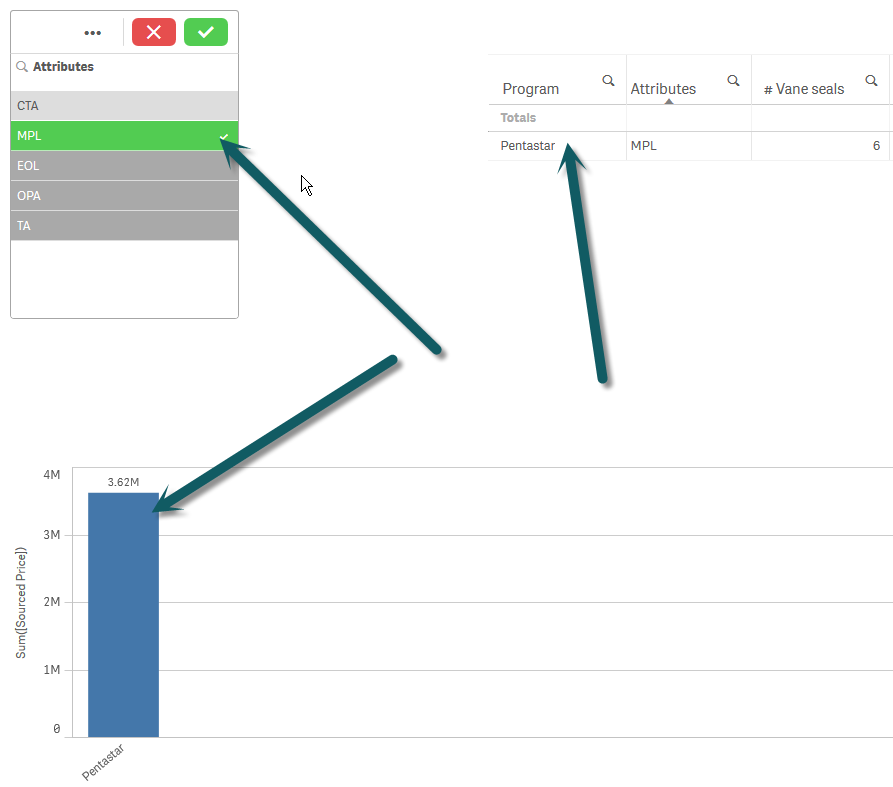

If you just want one - we could create an expression like this and use it for the measure.
Sum({$<Attributes={'CTA'}>}[Sourced Price])
So now we are just looking at the Sourced Price where attributes equals CTA - so you may have to create a separate chart for each attribute:
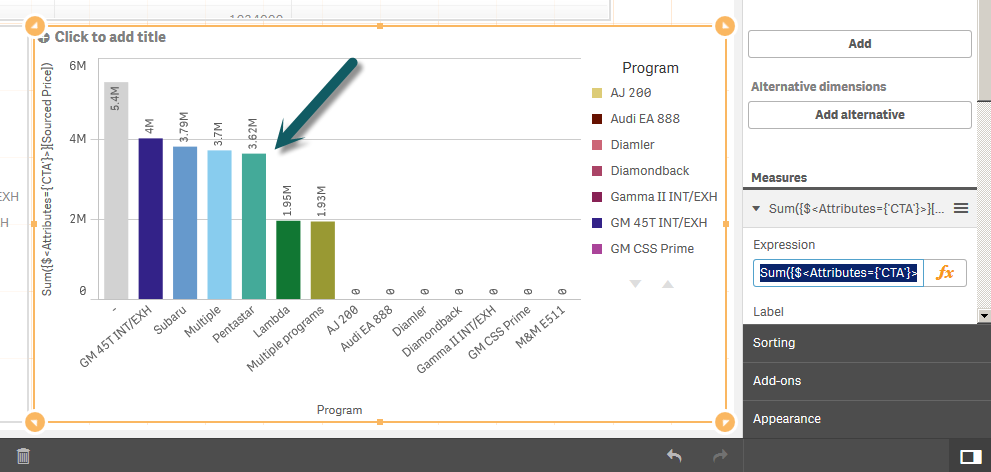
You can uncheck: Include zero values to hide the 0's

2 charts for sourced price - one for CTA and one for MPL
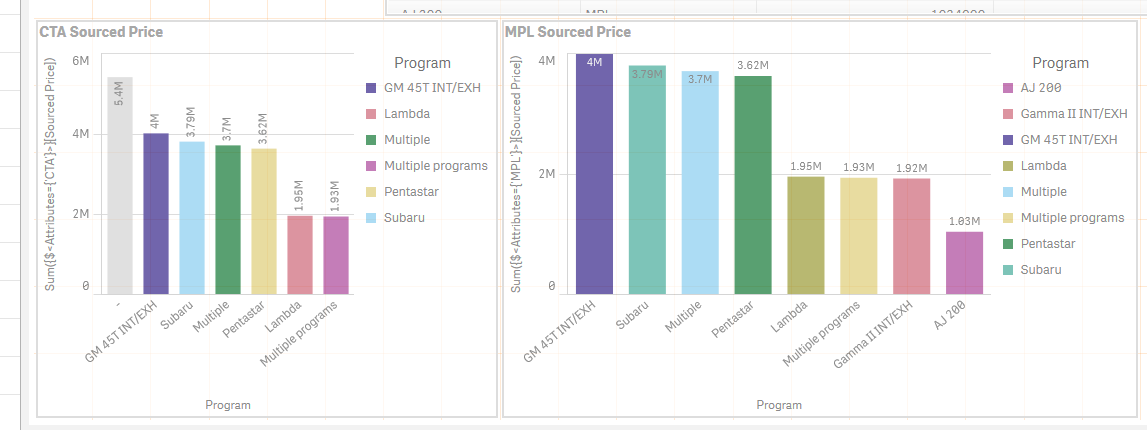
This syntax is known as Set Analysis and is a very flexible and powerful expression.
You can learn more about it here:
A Beginners' Introduction to Set Analysis (video)
Let me know
When applicable please mark the appropriate replies as CORRECT. This will help community members and Qlik Employees know which discussions have already been addressed and have a possible known solution. Please mark threads as HELPFUL if the provided solution is helpful to the problem, but does not necessarily solve the indicated problem. You can mark multiple threads as HELPFUL if you feel additional info is useful to others.
Regards,
Michael Tarallo (@mtarallo) | Twitter
Qlik
Mike Tarallo
Qlik
- Mark as New
- Bookmark
- Subscribe
- Mute
- Subscribe to RSS Feed
- Permalink
- Report Inappropriate Content
The idea was that we wanted them all in the same column so that you could pick the program and see what attributes it was part of. The solution below doesn’t really help with that. The data was provided to me in the format that I showed you. How else could we remedy this?
Ariana
- Mark as New
- Bookmark
- Subscribe
- Mute
- Subscribe to RSS Feed
- Permalink
- Report Inappropriate Content
Looks like you may have to manipulate the source data to be in a proper dimensional data format - currently you are loading the measures multiple times each time with a different attribute- I'll see if some of our resident experts can take a look.
Mike Tarallo
Qlik
- « Previous Replies
-
- 1
- 2
- Next Replies »