Unlock a world of possibilities! Login now and discover the exclusive benefits awaiting you.
- Qlik Community
- :
- Forums
- :
- Analytics
- :
- New to Qlik Analytics
- :
- Visualisation with data from two associated tables
- Subscribe to RSS Feed
- Mark Topic as New
- Mark Topic as Read
- Float this Topic for Current User
- Bookmark
- Subscribe
- Mute
- Printer Friendly Page
- Mark as New
- Bookmark
- Subscribe
- Mute
- Subscribe to RSS Feed
- Permalink
- Report Inappropriate Content
Visualisation with data from two associated tables
Hello,
I have two different tables, one represents a portfolio database and the other corresponds to production rate. I would like to have a pivot table as a visualisation showing rate*price in order to calculate the budget.
Table Base_Article
| REF | Program | Code | SalePrice | |
|---|---|---|---|---|
| A | A350 | NT | 100 |
Table Rates
| Program | Code | 01/01/2018 | 01/02/2018 | 01/03/2018 |
|---|---|---|---|---|
| A350 | NT | 8 | 7 | 6 |
I used a Crosstable transformation on this second table to import it.Those tables are associated with the key : Program-Code
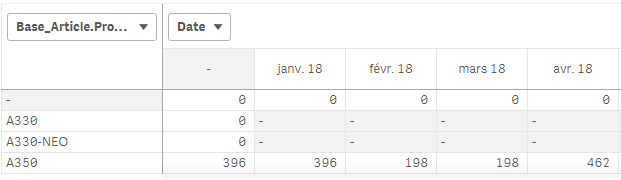
I would like to have the following table in my visualisation :
| Program | 01/01/2018 | 01/02/2018 | 01/03/2018 |
|---|---|---|---|
| A350 | =8*100 | =7*100 | =6*100 |
Do you have some idea how could I do that ?
I tried the formula : sum(Cadence*SalePrice) but it doesn't work
I attached an example file.
Thanks
Accepted Solutions
- Mark as New
- Bookmark
- Subscribe
- Mute
- Subscribe to RSS Feed
- Permalink
- Report Inappropriate Content
Hi Caroline,
Qlik's data engine is associative by nature and should link two separate tables in your data model automatically without having to perform joins in the script
It uses fieldnames that are exactly the same to perform the matching, so as long as the key is exactly the same (including case) in both tables then it will automatically join them and you can perform the expression
Script:
Base_Article:
LOAD Program & Code as kyProgramCode, *;
LOAD * FROM [lib://DL/bdd_test.xlsx] (ooxml, embedded labels, table is BASE_ARTICLE);
//"unpivot" the original table using crosstable
Rates:
CrossTable(tmpDate,Rate)
LOAD
Program & Code as kyProgramCode,
"43101",
"43132",
"43160",
"43191",
"43221",
"43252",
"43282",
"43313",
"43344",
"43374",
"43405",
"43435"
FROM [lib://DL/bdd_test.xlsx]
(ooxml, embedded labels, table is Rates);
//reload the table with re-formatted dates
Left join (Rates) Load kyProgramCode, date(num#(tmpDate)) as Date, tmpDate resident Rates;
drop field tmpDate;
Expression in app:
=sum(SalesPrice*Rate)
Is this what you are trying to do?
Erica
- Mark as New
- Bookmark
- Subscribe
- Mute
- Subscribe to RSS Feed
- Permalink
- Report Inappropriate Content
Hi,
Try this:
- Load Base_Article
- Cross Table Rates (Program, Code, Date, Cadence)
- Join 2 table : Base_Article & Rates
- Add column sum(Cadence * SalePrice)
- Drop table
- Done
Hope this helps.
Justin.
- Mark as New
- Bookmark
- Subscribe
- Mute
- Subscribe to RSS Feed
- Permalink
- Report Inappropriate Content
Hi Caroline,
Qlik's data engine is associative by nature and should link two separate tables in your data model automatically without having to perform joins in the script
It uses fieldnames that are exactly the same to perform the matching, so as long as the key is exactly the same (including case) in both tables then it will automatically join them and you can perform the expression
Script:
Base_Article:
LOAD Program & Code as kyProgramCode, *;
LOAD * FROM [lib://DL/bdd_test.xlsx] (ooxml, embedded labels, table is BASE_ARTICLE);
//"unpivot" the original table using crosstable
Rates:
CrossTable(tmpDate,Rate)
LOAD
Program & Code as kyProgramCode,
"43101",
"43132",
"43160",
"43191",
"43221",
"43252",
"43282",
"43313",
"43344",
"43374",
"43405",
"43435"
FROM [lib://DL/bdd_test.xlsx]
(ooxml, embedded labels, table is Rates);
//reload the table with re-formatted dates
Left join (Rates) Load kyProgramCode, date(num#(tmpDate)) as Date, tmpDate resident Rates;
drop field tmpDate;
Expression in app:
=sum(SalesPrice*Rate)
Is this what you are trying to do?
Erica
- Mark as New
- Bookmark
- Subscribe
- Mute
- Subscribe to RSS Feed
- Permalink
- Report Inappropriate Content
When applicable please mark the appropriate replies as CORRECT. This will help community members and Qlik Employees know which discussions have already been addressed and have a possible known solution. Please mark threads as HELPFUL if the provided solution is helpful to the problem, but does not necessarily solve the indicated problem. You can mark multiple threads as HELPFUL if you feel additional info is useful to others
- Mark as New
- Bookmark
- Subscribe
- Mute
- Subscribe to RSS Feed
- Permalink
- Report Inappropriate Content
Thanks a lot !
Should I see a difference in the table after the "join" ?
It works, I just have a new issue with data that appears with "-" instead of the value. Do you know how to fix this issue ?
- Mark as New
- Bookmark
- Subscribe
- Mute
- Subscribe to RSS Feed
- Permalink
- Report Inappropriate Content
I think its to do with the data that you sent me.
In the Base_Article, for the Product A330-NEO there is only sale price when the Code = NZF
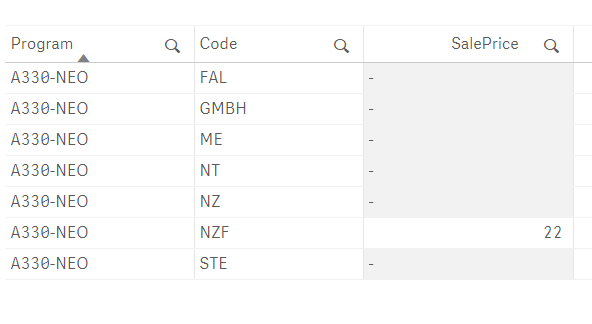
There is no corresponding row in the Rates table for this combination of product and code.
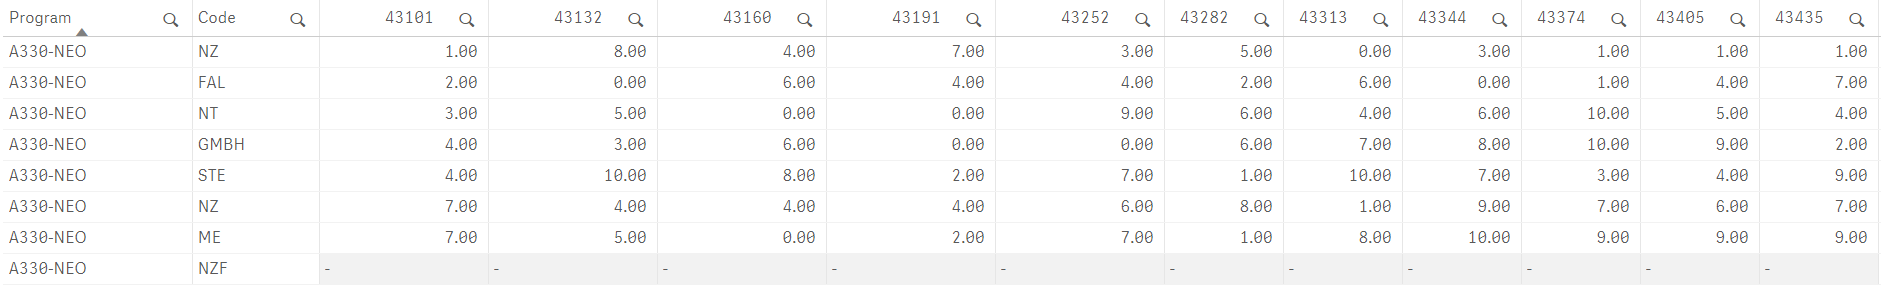
Therefore they will not match and will return only null.
Erica