Unlock a world of possibilities! Login now and discover the exclusive benefits awaiting you.
- Qlik Community
- :
- Forums
- :
- Analytics
- :
- New to Qlik Analytics
- :
- Re: Waterfall diagram
- Subscribe to RSS Feed
- Mark Topic as New
- Mark Topic as Read
- Float this Topic for Current User
- Bookmark
- Subscribe
- Mute
- Printer Friendly Page
- Mark as New
- Bookmark
- Subscribe
- Mute
- Subscribe to RSS Feed
- Permalink
- Report Inappropriate Content
Waterfall diagram
Hi all,
Can you please help me to prepare a waterfall diagram for the below requirement.
Transaction_No,Column 1 , Column 2, Column 3, Week
1 1 1 1 Week 51
2 1 0 1 Week 51
3 0 1 1 Week 51
i need to show transaction_no as how many columns.
Thanks,
Gowtham
Accepted Solutions
- Mark as New
- Bookmark
- Subscribe
- Mute
- Subscribe to RSS Feed
- Permalink
- Report Inappropriate Content
This is the print screen
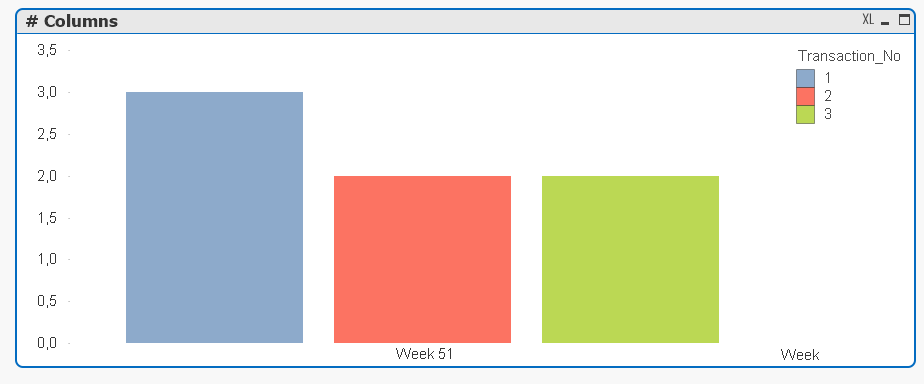
And this is the script I created
temp01:
CROSSTABLE (Date,Numbers,2) LOAD
Transaction_No,
Week,
[Column 1],
[Column 2],
[Column 3]
INLINE [
Transaction_No, Column 1, Column 2, Column 3, Week
1, 1, 1, 1, Week 51
2, 1, 0, 1, Week 51
3, 0, 1, 1, Week 51
];
NoOfNumbers:
LOAD
Transaction_No,
Week,
SUM(Numbers) AS Numbers
RESIDENT temp01
GROUP BY Transaction_No,Week;
DROP TABLE temp01;
- Mark as New
- Bookmark
- Subscribe
- Mute
- Subscribe to RSS Feed
- Permalink
- Report Inappropriate Content
Hi Gowtham, Ganapthi,
I created a bar chart (basis for waterfall) with the sum of the columns (column 1 + column 2 + column 3) per transaction ID.
Basically because you don't have negative values you don't exactly get a waterfall chart, but the script allows you to add the negative numbers, so add some data and you should be fine.
- Mark as New
- Bookmark
- Subscribe
- Mute
- Subscribe to RSS Feed
- Permalink
- Report Inappropriate Content
Im not able to open the qvw file can you send me the screenshot
- Mark as New
- Bookmark
- Subscribe
- Mute
- Subscribe to RSS Feed
- Permalink
- Report Inappropriate Content
This is the print screen
And this is the script I created
temp01:
CROSSTABLE (Date,Numbers,2) LOAD
Transaction_No,
Week,
[Column 1],
[Column 2],
[Column 3]
INLINE [
Transaction_No, Column 1, Column 2, Column 3, Week
1, 1, 1, 1, Week 51
2, 1, 0, 1, Week 51
3, 0, 1, 1, Week 51
];
NoOfNumbers:
LOAD
Transaction_No,
Week,
SUM(Numbers) AS Numbers
RESIDENT temp01
GROUP BY Transaction_No,Week;
DROP TABLE temp01;