Unlock a world of possibilities! Login now and discover the exclusive benefits awaiting you.
- Qlik Community
- :
- Forums
- :
- Analytics
- :
- New to Qlik Analytics
- :
- Weighted meridian in a straight table
- Subscribe to RSS Feed
- Mark Topic as New
- Mark Topic as Read
- Float this Topic for Current User
- Bookmark
- Subscribe
- Mute
- Printer Friendly Page
- Mark as New
- Bookmark
- Subscribe
- Mute
- Subscribe to RSS Feed
- Permalink
- Report Inappropriate Content
Weighted meridian in a straight table
Hi experts,
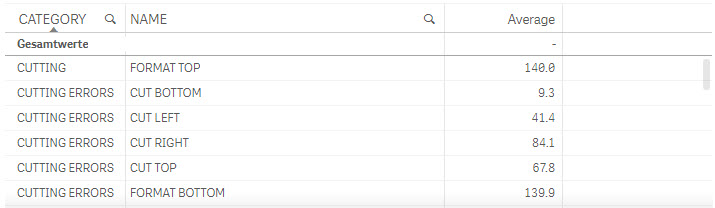
I try to apply a formula for calculating the median of weighted values (like in the post from Matt King Weighted median) in a straight table and I want to apply the formula from Marco Wedel to all dimension values in the table. I was able to calculate it for the average, because there you don't Need to Aggregate. Now I want to calculate the median for FORMAT TOP, CUT BOTTOM, ....
If I select a mesurement (NAME), then the calculation is working, but if I don't have anything selected, there is only 1 result for the whole table instead of one result per row.
I thought something like
Aggr({<COLLECTION={'SENSOR MEASUREMENTS'},RESULT_TYPE={'number'}>}
If(
((RangeSum(Above(Sum(HAEUFIGKEIT),0,RowNo())) /
Sum(TOTAL HAEUFIGKEIT))>=0.5) And
((RangeSum(Above(Sum(HAEUFIGKEIT),1,RowNo()-1)) /
Sum(TOTAL HAEUFIGKEIT))<0.5),
ERGEBNIS
),
(ERGEBNIS,(NUMERIC,ASCENDING)),NAME
)
might do the trick. But it doesn't and I would be happy, if I got some hints about how to handle this.
Already in advance, thank you very much for your support.
Best regards
Dirk
- « Previous Replies
-
- 1
- 2
- Next Replies »
- Mark as New
- Bookmark
- Subscribe
- Mute
- Subscribe to RSS Feed
- Permalink
- Report Inappropriate Content
Hi,
can you please post a sample application we can test possible solutions with?
thanks
regards
Marco
- Mark as New
- Bookmark
- Subscribe
- Mute
- Subscribe to RSS Feed
- Permalink
- Report Inappropriate Content
Hi Marco,
I prepared a sampe qvf, but I'm not sure how to upload it. I uploaded document in the first step. Can you tell me what do I have to do to attach it to a reply?
Thank you very much for your support.
Best regards,
Dirk
- Mark as New
- Bookmark
- Subscribe
- Mute
- Subscribe to RSS Feed
- Permalink
- Report Inappropriate Content
don't reply from your inbox, open the thread as new tab in your browser instead.
Click on "use advanced editor" in the upper right corner and "Attach" in the lower right corner of the editor.
hope this helps
regards
Marco
- Mark as New
- Bookmark
- Subscribe
- Mute
- Subscribe to RSS Feed
- Permalink
- Report Inappropriate Content
Hi Marco,
thank you very much. Now I was able to attach the sample data, I extracted.
Thank you very much for your help.
Best regards
Dirk
- Mark as New
- Bookmark
- Subscribe
- Mute
- Subscribe to RSS Feed
- Permalink
- Report Inappropriate Content
Hi Marco, hello experts
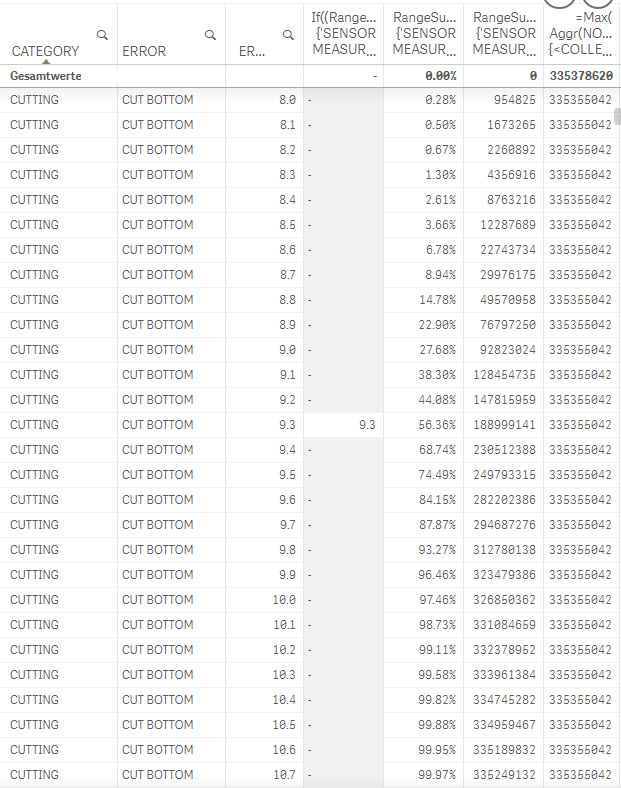
I don't know, if you have time to look further into this, but I managed to get the rangesum working for the different results in the table. Formula below provides thise results.
RangeSum(Above(Aggr({<COLLECTION={'SENSOR MEASUREMENTS'},RESULT_TYPE={'number'}>}
Sum(HAEUFIGKEIT),
(ERGEBNIS,(NUMERIC,ASCENDING)),ERROR,CATEGORY)
,0,RowNo()
)
)
However, if I try to calculate in the same table the sum of HAEUFIGKEIT the errors, it returns only one result. This seems to be in the middle of the available results.
=Aggr(Sum({<COLLECTION={'SENSOR MEASUREMENTS'},RESULT_TYPE={'number'}>} HAEUFIGKEIT),
ERROR,CATEGORY)
If I use the same formula in a table, where ERGEBNIS is not part of the dimensions, the formula provides the desired result. But if I combine both formulas, null is returned.
Any suggestions, how to overcome this problem? In principle I need to aggregate per error and category and ignore the grouping for the ERGEBNIS in second part of the formula, where the aggregation must be per ERGEBNIS in the first part of the formula.
If anybody has a suggestion for a solution, this would be phantastic.
Best regards
Dirk
- Mark as New
- Bookmark
- Subscribe
- Mute
- Subscribe to RSS Feed
- Permalink
- Report Inappropriate Content
Hi experts,
I'm one step closer to the solution, but not there yet and maybe somebody has an idea, how to go the final step.
In the straight table showing the results for each meaurement, this provides me the Meridian. But if I try to apply it to a table, where the different results are not displayed, the function returns only Null.
So I believe to have it working in the reduced table, I ned to do some additional Aggregation, but how??
Any input would be very much appreciated.
Regards
Dirk
If((RangeSum(Above(Aggr({<COLLECTION={'SENSOR MEASUREMENTS'},RESULT_TYPE={'number'}>}
Sum(HAEUFIGKEIT),
(ERGEBNIS,(NUMERIC,ASCENDING)),ERROR,CATEGORY),
0,RowNo()
)
)
/
Max(Aggr(NODISTINCT {<COLLECTION={'SENSOR MEASUREMENTS'},RESULT_TYPE={'number'}>}
Sum(HAEUFIGKEIT),
ERROR,CATEGORY))
>=0.5) And
(RangeSum(Above(Aggr({<COLLECTION={'SENSOR MEASUREMENTS'},RESULT_TYPE={'number'}>}
Sum(HAEUFIGKEIT),
(ERGEBNIS,(NUMERIC,ASCENDING)),ERROR,CATEGORY),
1,RowNo()-1
)
)
/
Max(Aggr(NODISTINCT {<COLLECTION={'SENSOR MEASUREMENTS'},RESULT_TYPE={'number'}>}
Sum(HAEUFIGKEIT),
ERROR,CATEGORY))
<0.5),
ERGEBNIS
)
- Mark as New
- Bookmark
- Subscribe
- Mute
- Subscribe to RSS Feed
- Permalink
- Report Inappropriate Content
Hello experts,
accidently I got one step closer to the target, but I'm not there and maybe somebody has an idea,what's the reason for the behaviour I get.
Now I use the 1st formula for calculating the median from my weighted data and the 2nd formula for the calculation of the 25 % quartile.
MEDIAN:
If((RangeSum(Above(Aggr(NoDistinct
Sum({<COLLECTION={'SENSOR MEASUREMENTS'},RESULT_TYPE={'number'}>} HAEUFIGKEIT),
(ERGEBNIS,(NUMERIC,ASCENDING)),ERROR,CATEGORY),
0,RowNo()
)
)
/
Max(Aggr(NoDistinct
Sum({<COLLECTION={'SENSOR MEASUREMENTS'},RESULT_TYPE={'number'}>} HAEUFIGKEIT),
ERROR,CATEGORY))
>=0.5) And
(RangeSum(Above(Aggr(Sum({<COLLECTION={'SENSOR MEASUREMENTS'},RESULT_TYPE={'number'}>}HAEUFIGKEIT),
(ERGEBNIS,(NUMERIC,ASCENDING)),ERROR,CATEGORY),
1,RowNo()-1
)
)
/
Max(Aggr(NoDistinct
Sum({<COLLECTION={'SENSOR MEASUREMENTS'},RESULT_TYPE={'number'}>} HAEUFIGKEIT),
ERROR,CATEGORY))
<0.5),
ERGEBNIS,0
)
25% QUARTILE.
If((RangeSum(Above(Aggr(NoDistinct
Sum({<COLLECTION={'SENSOR MEASUREMENTS'},RESULT_TYPE={'number'}>} HAEUFIGKEIT),
(ERGEBNIS,(NUMERIC,ASCENDING)),ERROR,CATEGORY),
0,RowNo()
)
)
/
Max(Aggr(NoDistinct
Sum({<COLLECTION={'SENSOR MEASUREMENTS'},RESULT_TYPE={'number'}>} HAEUFIGKEIT),
ERROR,CATEGORY))
>=0.25) And
(RangeSum(Above(Aggr(Sum({<COLLECTION={'SENSOR MEASUREMENTS'},RESULT_TYPE={'number'}>}HAEUFIGKEIT),
(ERGEBNIS,(NUMERIC,ASCENDING)),ERROR,CATEGORY),
1,RowNo()-1
)
)
/
Max(Aggr(NODISTINCT
Sum({<COLLECTION={'SENSOR MEASUREMENTS'},RESULT_TYPE={'number'}>} HAEUFIGKEIT),
ERROR,CATEGORY))
<0.25),
ERGEBNIS,0
)
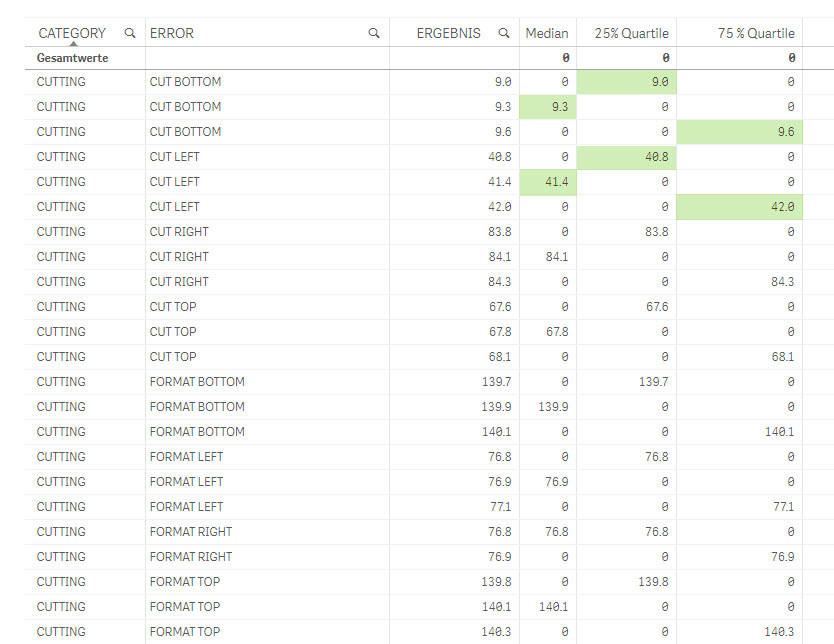
The Image below shows, the results, if I have a dimension ERGEBNIS in the table. Of course, I would like not to have the Dimension ERGEBNIS and I would like to have only one row per ERROR. If I remove the Dimension ERGEBNIS, I don't get any datasets displayed in the table anymore.
So the formula is close, but not fully what I need. I tried to put a Max(Aggr(,CATEGORY,ERROR) around my IF statement, but this returns only 0.
Does anybody have a suggestion how to get the rid of the multiple rows for each error?
Best regards,
Dirk
- Mark as New
- Bookmark
- Subscribe
- Mute
- Subscribe to RSS Feed
- Permalink
- Report Inappropriate Content
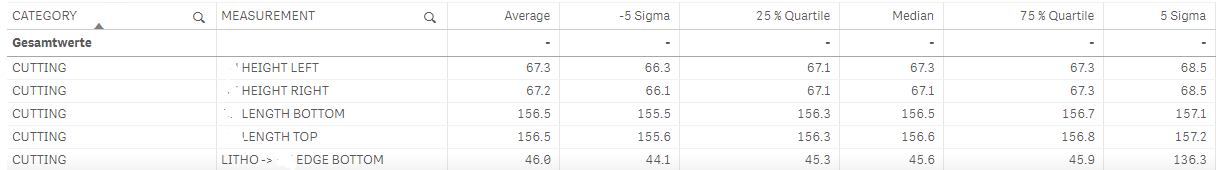
Hello everybody,
finally I found the solution for my Problem, based upon the design blog of HIC (thank you very much for this valuable explanation).
If somebody is looking for calculating the median or quantiles based upon pre-aggregated values and displaying the results in a straigt table (so you can have an overview of the results for different measurements), the following formula works for me.
Median:
Aggr({<RESULT_TYPE={'UNSIGNED_INT_7_BIT','SIGNED_INT_13_BIT'}>} NoDistinct
Only(If(Aggr({<RESULT_TYPE={'UNSIGNED_INT_7_BIT','SIGNED_INT_13_BIT'}>} NoDistinct
RangeSum(Above(Sum({<RESULT_TYPE={'UNSIGNED_INT_7_BIT','SIGNED_INT_13_BIT'}>}FREQUENCY),
0,RowNo())),RULE_NAME,(RESULT,(NUMERIC,ASCENDING))) /
Aggr({<RESULT_TYPE={'UNSIGNED_INT_7_BIT','SIGNED_INT_13_BIT'}>} NoDistinct
Sum({<RESULT_TYPE={'UNSIGNED_INT_7_BIT','SIGNED_INT_13_BIT'}>}FREQUENCY),RULE_NAME) >=0.5
And
Aggr({<RESULT_TYPE={'UNSIGNED_INT_7_BIT','SIGNED_INT_13_BIT'}>} NoDistinct
RangeSum(Above(Sum({<RESULT_TYPE={'UNSIGNED_INT_7_BIT','SIGNED_INT_13_BIT'}>}FREQUENCY),
1,RowNo())),RULE_NAME,(RESULT,(NUMERIC,ASCENDING))) /
Aggr({<RESULT_TYPE={'UNSIGNED_INT_7_BIT','SIGNED_INT_13_BIT'}>} NoDistinct
Sum({<RESULT_TYPE={'UNSIGNED_INT_7_BIT','SIGNED_INT_13_BIT'}>}FREQUENCY),RULE_NAME)<0.5,
RESULT)),
RULE_NAME)
Best regards,
Dirk
- « Previous Replies
-
- 1
- 2
- Next Replies »