Unlock a world of possibilities! Login now and discover the exclusive benefits awaiting you.
- Qlik Community
- :
- Forums
- :
- Analytics
- :
- New to Qlik Analytics
- :
- Re: Which charts are best fit to show ranks in Qli...
- Subscribe to RSS Feed
- Mark Topic as New
- Mark Topic as Read
- Float this Topic for Current User
- Bookmark
- Subscribe
- Mute
- Printer Friendly Page
- Mark as New
- Bookmark
- Subscribe
- Mute
- Subscribe to RSS Feed
- Permalink
- Report Inappropriate Content
Which charts are best fit to show ranks in Qlik Sense?
Apart from a bar chart and a pie chart, which other charts are visually attractive to show rankings in Qlik Sense?
- Mark as New
- Bookmark
- Subscribe
- Mute
- Subscribe to RSS Feed
- Permalink
- Report Inappropriate Content
a straight table with a linear gauge
or a Funnel Chart maybe
If a post helps to resolve your issue, please accept it as a Solution.
- Mark as New
- Bookmark
- Subscribe
- Mute
- Subscribe to RSS Feed
- Permalink
- Report Inappropriate Content
Hi Vineeth,
A straight table with a linear gauge? Could you please share a snapshot of how this looks?
Thank you.
- Mark as New
- Bookmark
- Subscribe
- Mute
- Subscribe to RSS Feed
- Permalink
- Report Inappropriate Content
See this post
If a post helps to resolve your issue, please accept it as a Solution.
- Mark as New
- Bookmark
- Subscribe
- Mute
- Subscribe to RSS Feed
- Permalink
- Report Inappropriate Content
The question was about Qlik Sense Vineeth.
Such a functionnality doesn't exist by default in Qlik Sense tables. But With that in mind, you can always create mini gauges in Qlik Sense Divya.
Please refer to this document:
- Mark as New
- Bookmark
- Subscribe
- Mute
- Subscribe to RSS Feed
- Permalink
- Report Inappropriate Content
Hi,
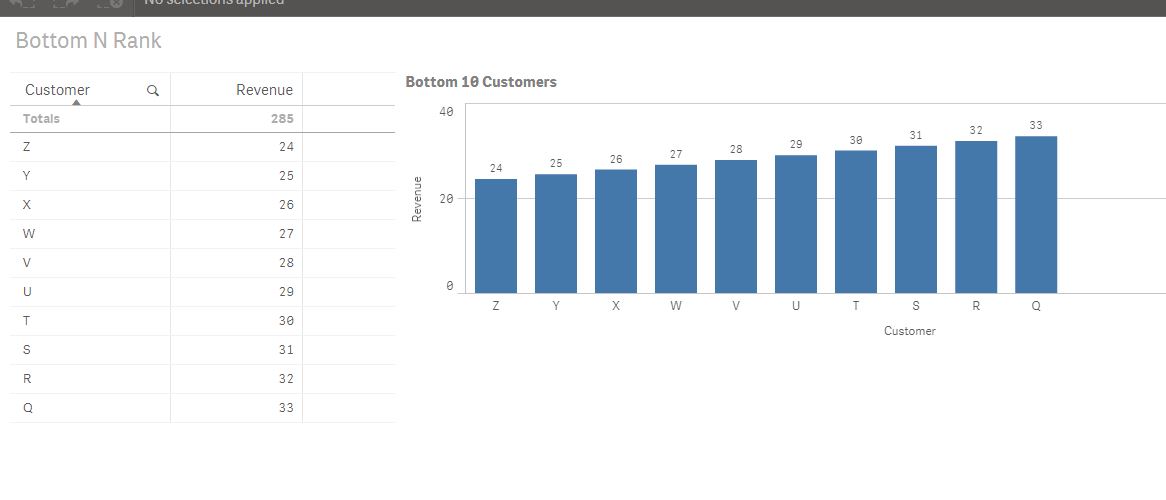
Refer to the attachment, i would go with Bar Chart. Thanks
Example,
- Mark as New
- Bookmark
- Subscribe
- Mute
- Subscribe to RSS Feed
- Permalink
- Report Inappropriate Content
lol, I don't work in Sense so i didn't knew Sense didn't have Linear Gauges, what a shame.
Atleast the OP knows what linear gauges are now 
If a post helps to resolve your issue, please accept it as a Solution.
- Mark as New
- Bookmark
- Subscribe
- Mute
- Subscribe to RSS Feed
- Permalink
- Report Inappropriate Content
Hi Omar,
Mini Chart is an interesting work around for the linear gauge within the tables.
However, I wouldn't prefer to show the rankings in a table. The reason I put this question up on the community is to find out if there are any visually attractive charts out there in Qlik Sense apart from the regular tables, bar charts, pie charts to show rankings.
Any idea?
Thank you.
- Mark as New
- Bookmark
- Subscribe
- Mute
- Subscribe to RSS Feed
- Permalink
- Report Inappropriate Content
Hi Devarasu,
Thank you for the response.
I am aware of this feature in Qlik Sense. I am hunting for a visually attractive, something out of the box solution to present the rankings. Maybe there is something out there (Extensions) that I am not aware of which could be a good solution for my question.
Any idea?
Thank you.
- Mark as New
- Bookmark
- Subscribe
- Mute
- Subscribe to RSS Feed
- Permalink
- Report Inappropriate Content
And Thank you very much for the PDF files. Really helpful.