Unlock a world of possibilities! Login now and discover the exclusive benefits awaiting you.
- Qlik Community
- :
- Forums
- :
- Analytics
- :
- New to Qlik Analytics
- :
- Re: Year to Year Comparison Pivot table via Set An...
- Subscribe to RSS Feed
- Mark Topic as New
- Mark Topic as Read
- Float this Topic for Current User
- Bookmark
- Subscribe
- Mute
- Printer Friendly Page
- Mark as New
- Bookmark
- Subscribe
- Mute
- Subscribe to RSS Feed
- Permalink
- Report Inappropriate Content
Year to Year Comparison Pivot table via Set Analysis
Hi all,
I'm new to QlikSense and right now I am building a QlikSense Prototype. I am struggling with a year to year comparison.
I have created a Pivot table
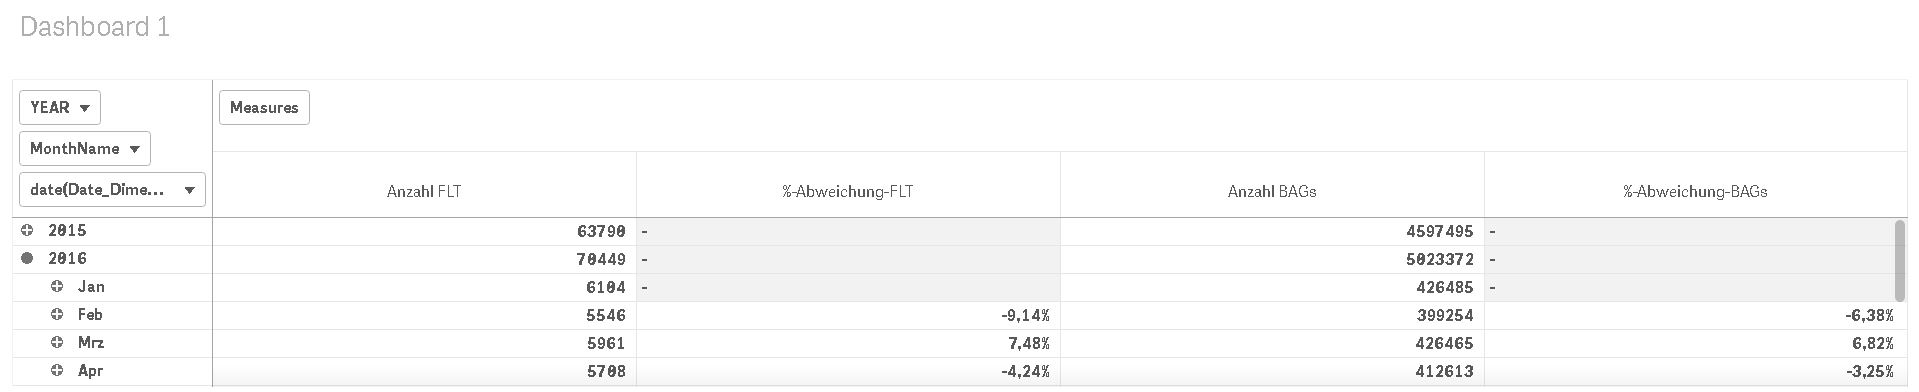
As you can see I have 2 colums and multiple rows. What I want now is to compare "Anzahl FLT" for 2016 with 2015. I used "above" in the screenshot but this doesn't work when I break down the Pivot table into months.
So for example when i go to 01.01.2016 I want to see the percentage differance to 01/01/2015.
So first level of the hierarchy would be a comparison from 2016 - 2015
When the user opens up months it should show Month/2016 - Month/2015
And then the dates.
In a KPI I used this formula:
(sum({$<YEAR={'2016'}>}N_FLIGHTS)
- sum({$<YEAR= {'2015'}>}N_FLIGHTS))
/ sum({$<YEAR={'2015'}>}N_FLIGHTS)
This shows me the year to year differance in the KPI. But I can't insert the formula into the pivot table. In there I need a general formula.
I have asked somebody about this and the person said the formula needs to roll back 12 months back. But he couldn't tell me how that works.
Thank you for your help!
- « Previous Replies
-
- 1
- 2
- Next Replies »
- Mark as New
- Bookmark
- Subscribe
- Mute
- Subscribe to RSS Feed
- Permalink
- Report Inappropriate Content
If I'm using more years instead of just 2, can I use the following script:
AsOfTable:
LOAD DISTINCT
[Date_Dimension] as AsOfDate,
Month([Date_Dimension]) as AsOfMonth,
Year([Date_Dimension]) as AsOfYear,
[Date_Dimension],
'2017' as Flag
Resident [DIM_DATE];
Concatenate(AsOfTable)
LOAD DISTINCT
[Date_Dimension] as AsOfDate,
Month([Date_Dimension]) as AsOfMonth,
Year([Date_Dimension]) as AsOfYear,
AddYears([Date_Dimension], -1) as [Date_Dimension],
'2016' as Flag
Resident [DIM_DATE];
Concatenate(AsOfTable)
LOAD DISTINCT
[Date_Dimension] as AsOfDate,
Month([Date_Dimension]) as AsOfMonth,
Year([Date_Dimension]) as AsOfYear,
AddYears([Date_Dimension], -2) as [Date_Dimension],
'2015' as Flag
Resident [DIM_DATE];
what I changed in here is instead of "Current Year" and "Previous Year" I'm not using 2017, 2016, 2015 and in the line
AddYears([Date_Dimension], -1) as [Date_Dimension]
-1 for 2016
and -2 for 2015. Would that be correct?
The first expression would change to
Sum({<YEAR={'2015','2016','2017'}, Flag = {'2017'}>}N_FLIGHTS)
right?
Thanks a lot for you help 
- Mark as New
- Bookmark
- Subscribe
- Mute
- Subscribe to RSS Feed
- Permalink
- Report Inappropriate Content
Yes looks great to me. I am glad you picked this up really fast
- Mark as New
- Bookmark
- Subscribe
- Mute
- Subscribe to RSS Feed
- Permalink
- Report Inappropriate Content
Hi Sunny,
short Question for the expressions where the %-difference is calculated:
I have no several years and want to show the %-difference from each year to the year before. so 2017 difference to 2016, 2016 difference to 2015, 2015 -> 2014
The script looks like this:
AsOfTable:
LOAD DISTINCT
[DATE_DIMENSION] as AsOfDate,
Month([DATE_DIMENSION]) as AsOfMonth,
Year([DATE_DIMENSION]) as AsOfYear,
[DATE_DIMENSION],
'2017' as Flag
Resident [DIM_DATUM];
Concatenate(AsOfTable)
LOAD DISTINCT
[DATE_DIMENSION] as AsOfDate,
Month([DATE_DIMENSION]) as AsOfMonth,
Year([DATE_DIMENSION]) as AsOfYear,
AddYears([DATE_DIMENSION], -1) as [Date_Dimension],
'2016' as Flag
Resident [DIM_DATUM];
Concatenate(AsOfTable)
LOAD DISTINCT
[DATE_DIMENSION] as AsOfDate,
Month([DATE_DIMENSION]) as AsOfMonth,
Year([DATE_DIMENSION]) as AsOfYear,
AddYears([DATE_DIMENSION], -2) as [Date_Dimension],
'2015' as Flag
Resident [DIM_DATUM];
Concatenate(AsOfTable)
LOAD DISTINCT
[DATE_DIMENSION] as AsOfDate,
Month([DATE_DIMENSION]) as AsOfMonth,
Year([DATE_DIMENSION]) as AsOfYear,
AddYears([DATE_DIMENSION], -3) as [Date_Dimension],
'2014' as Flag
Resident [DIM_DATUM];
Concatenate(AsOfTable)
LOAD DISTINCT
[DATE_DIMENSION] as AsOfDate,
Month([DATE_DIMENSION]) as AsOfMonth,
Year([DATE_DIMENSION]) as AsOfYear,
AddYears([DATE_DIMENSION], -4) as [Date_Dimension],
'2013' as Flag
Resident [DIM_DATUM];
how does the measure look like when I have more then 2 years?
I tried this but it's not really working:
If(Sum({<YEAR={'2013','2014','2015','2016','2017'}, Flag = {'2017'}>}N_FLIGHTS) > 0,
Sum({<YEAR={'2013','2014','2015','2016','2017'}, Flag = {'2017'}>}N_FLIGHTS)
/Sum({<YEAR={'2013','2014','2015','2016','2017'}, Flag = {'2016'}>}N_FLIGHTS) - 1)
Thanks Sunny
- Mark as New
- Bookmark
- Subscribe
- Mute
- Subscribe to RSS Feed
- Permalink
- Report Inappropriate Content
Would you mind sharing the updated qvf file for me to look at this?
- Mark as New
- Bookmark
- Subscribe
- Mute
- Subscribe to RSS Feed
- Permalink
- Report Inappropriate Content
There is an error here:
AsOfTable:
LOAD DISTINCT
[DATE_DIMENSION] as AsOfDate,
Month([DATE_DIMENSION]) as AsOfMonth,
Year([DATE_DIMENSION]) as AsOfYear,
[DATE_DIMENSION],
'2017' as Flag
Resident [DIM_DATUM];
Concatenate(AsOfTable)
LOAD DISTINCT
[DATE_DIMENSION] as AsOfDate,
Month([DATE_DIMENSION]) as AsOfMonth,
Year([DATE_DIMENSION]) as AsOfYear,
AddYears([DATE_DIMENSION], -1) as [Date_Dimension] [DATE_DIMENSION],
'2016' as Flag
Resident [DIM_DATUM];
Same issue for the other Concatenations.
Can you fix this and reload to see if it fixes your issue
- Mark as New
- Bookmark
- Subscribe
- Mute
- Subscribe to RSS Feed
- Permalink
- Report Inappropriate Content
Should be correct now
- Mark as New
- Bookmark
- Subscribe
- Mute
- Subscribe to RSS Feed
- Permalink
- Report Inappropriate Content
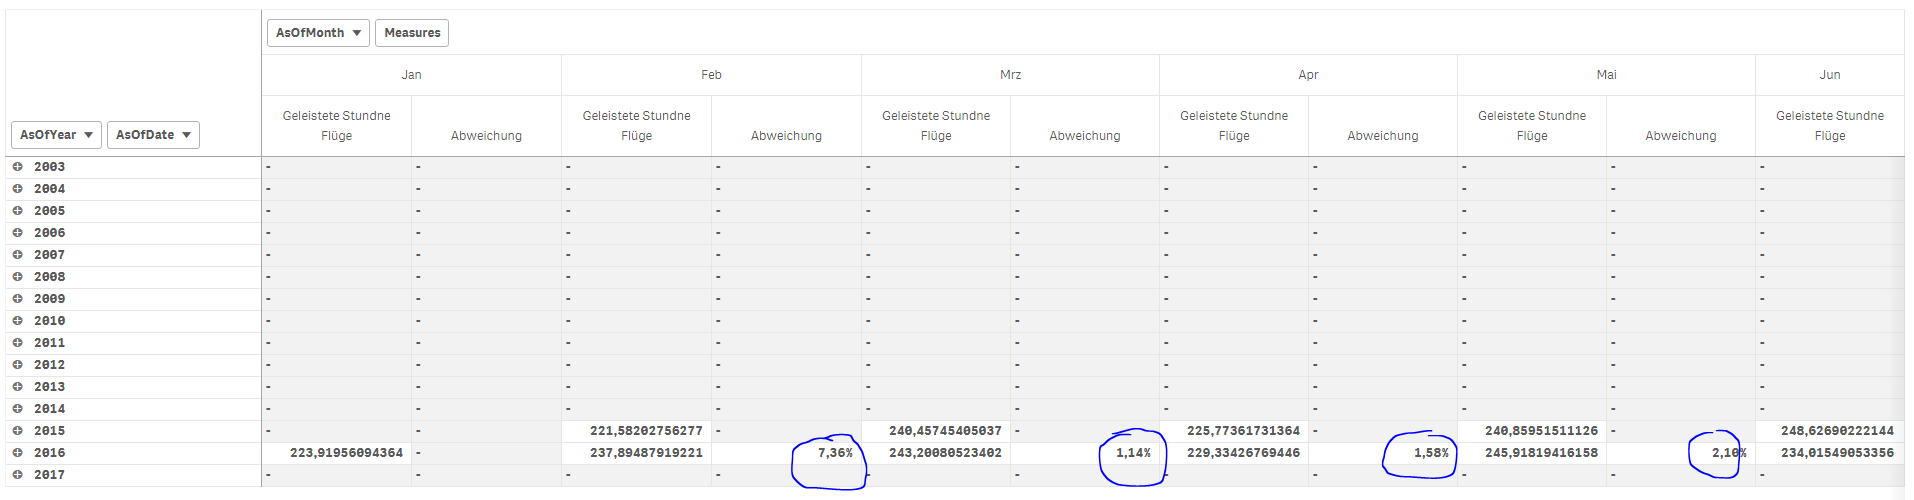
I think you only have BU_BU_WERY_SUM for 2017 and 2016, so the chart is only able to work for 2017. But one thing I noticed was that you were using DD_JAHR as your dimension and you need to use AsOfYear, AsOfMonth, and AsOfDate as your dimensions.
- Mark as New
- Bookmark
- Subscribe
- Mute
- Subscribe to RSS Feed
- Permalink
- Report Inappropriate Content
Correct I only have data for 2016/2015.
Thank you you are right I only have data for 2016/2015. So this means if I get later date for the other years i might have to write you again for your knowledge 
I have some troubles confirming the the values in my KPI.
I noticed that in the measures "Year" has no affect.
I created two KPIs
one with Sum({<Year = ('2016')>} N_FLIGHTS)
the strange thing is, the KPI doesn't show me amount of N_FLIGHTS for the Year 2016. It shows me the total amount of N_FLIGHTS. It doesn't matter if {<Year = ('2016')>} is in it.
What I'm trying to do is to validate the numbers inside of the pivot table by looking at the sum N_FLIGHTS for a month of a year and dividing that through the sum BU_BU_WERY_SUM of the same month and year.
But it somehow doesn't seem to work with "Year" and "Month"
Do you know why?
- Mark as New
- Bookmark
- Subscribe
- Mute
- Subscribe to RSS Feed
- Permalink
- Report Inappropriate Content
What is difference between Year and DD_JAHR? May be you need to use DD_JAHR
Sum({<DD_JAHR = ('2016')>} N_FLIGHTS)
- « Previous Replies
-
- 1
- 2
- Next Replies »