Unlock a world of possibilities! Login now and discover the exclusive benefits awaiting you.
- Qlik Community
- :
- Forums
- :
- Analytics
- :
- New to Qlik Analytics
- :
- YoY Difference and Growth
Options
- Subscribe to RSS Feed
- Mark Topic as New
- Mark Topic as Read
- Float this Topic for Current User
- Bookmark
- Subscribe
- Mute
- Printer Friendly Page
Turn on suggestions
Auto-suggest helps you quickly narrow down your search results by suggesting possible matches as you type.
Showing results for
Anonymous
Not applicable
2018-05-22
07:02 AM
- Mark as New
- Bookmark
- Subscribe
- Mute
- Subscribe to RSS Feed
- Permalink
- Report Inappropriate Content
YoY Difference and Growth
Hello everyone,
I'm looking for a method to visualize the difference between two years in a pivot table.
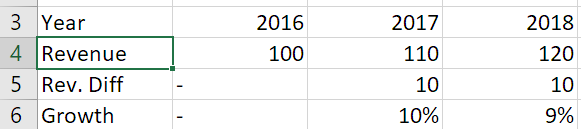
This is what I would like to get:
I tried this formula:
Sum( { $<[DocumentYear]={$(=max(DocumentYear))}>} Revenue)
- Sum( { $<[DocumentYear]={$(=max(DocumentYear)-1)}>} Revenue)
This is what I get:
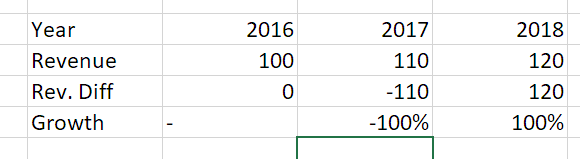
I guess each column filters the data for the choosen year and it is not possible to use the formula for my case.
Do you know a method for my case?
Thank you in advance!
432 Views
0 Replies
Community Browser