Unlock a world of possibilities! Login now and discover the exclusive benefits awaiting you.
- Qlik Community
- :
- Forums
- :
- Analytics
- :
- New to Qlik Analytics
- :
- Re: calculate WIP by comparing dates
- Subscribe to RSS Feed
- Mark Topic as New
- Mark Topic as Read
- Float this Topic for Current User
- Bookmark
- Subscribe
- Mute
- Printer Friendly Page
- Mark as New
- Bookmark
- Subscribe
- Mute
- Subscribe to RSS Feed
- Permalink
- Report Inappropriate Content
calculate WIP by comparing dates
Hello,
I would like to calculate the Work in Progress for my products so I would need to compare dates.
My table is :
| ID | Date | Date type |
|---|---|---|
| 1 | 10/03/2018 | beginning |
| 2 | 12/03/2018 | beginning |
| 3 | 13/03/2018 | beginning |
| 1 | 15/03/2018 | end |
| 2 | 18/03/2018 | end |
| 3 | 20/03/2018 | end |
I would like to draw a line chart showing the number of product that are between the beginning and the end date in function of generic dates. So I will have the number of product in the production line in function of dates.
Do you think I have to rearrane my table to do that ?
Could you please help me ? 
Best regards,
- Mark as New
- Bookmark
- Subscribe
- Mute
- Subscribe to RSS Feed
- Permalink
- Report Inappropriate Content
what is the Output ?
- Mark as New
- Bookmark
- Subscribe
- Mute
- Subscribe to RSS Feed
- Permalink
- Report Inappropriate Content
You'll have to use intervalMatch in the script to build this:
Please try to refer to this to understand the intervalMatch function :
- Mark as New
- Bookmark
- Subscribe
- Mute
- Subscribe to RSS Feed
- Permalink
- Report Inappropriate Content
Hi,
as omarbensalem suggest you have to generate missing date i.e date between beginning date & end date,
but instead of using interval match use logic mention in below thread.
It will very effective compare to interval match
Regards,
Please appreciate our Qlik community members by giving Kudos for sharing their time for your query. If your query is answered, please mark the topic as resolved 🙂
- Mark as New
- Bookmark
- Subscribe
- Mute
- Subscribe to RSS Feed
- Permalink
- Report Inappropriate Content
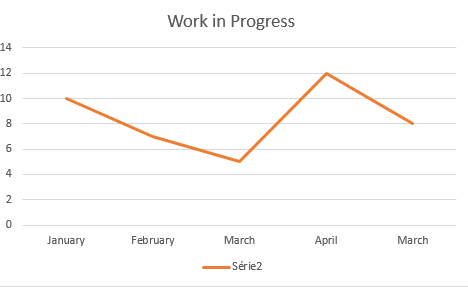
I would like something like that as an input
- Mark as New
- Bookmark
- Subscribe
- Mute
- Subscribe to RSS Feed
- Permalink
- Report Inappropriate Content
Can you explain a little bit more, what are you looking for?
Thank you
- Mark as New
- Bookmark
- Subscribe
- Mute
- Subscribe to RSS Feed
- Permalink
- Report Inappropriate Content
My data :
| ID product | beginning date | end date |
|---|---|---|
| 1 | 01/01/2018 | 01/02/2018 |
| 2 | 01/01/2018 | 01/03/2018 |
| 3 | 01/02/2018 | 01/03/2018 |
| 4 | 01/03/2018 | 01/04/2018 |
I would like to be able to have the following table :
| Date | Number of products in progress |
|---|---|
| January 2018 | 5 |
| February 2018 | 10 |
| March 2018 | 8 |
| April 2018 | 7 |
Number of products counts the number of product with beginningDate < current date < end date