Unlock a world of possibilities! Login now and discover the exclusive benefits awaiting you.
- Qlik Community
- :
- Forums
- :
- Analytics
- :
- New to Qlik Analytics
- :
- Re: college homework (Graphics)
- Subscribe to RSS Feed
- Mark Topic as New
- Mark Topic as Read
- Float this Topic for Current User
- Bookmark
- Subscribe
- Mute
- Printer Friendly Page
- Mark as New
- Bookmark
- Subscribe
- Mute
- Subscribe to RSS Feed
- Permalink
- Report Inappropriate Content
college homework (Graphics)
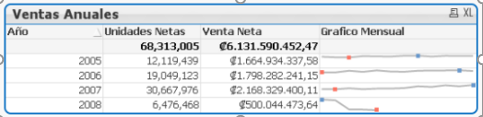
We are using Qlik sense for a homework and there is this image that I think is not available on Qlik sense by default, so I'am wondering if any one can help me getting the name of this kind of graphic.
If the graphic can not be found in Qlik sense by default and any one knows the name or even better where I can download it.
I'll be very thankfull.
- « Previous Replies
-
- 1
- 2
- Next Replies »
- Mark as New
- Bookmark
- Subscribe
- Mute
- Subscribe to RSS Feed
- Permalink
- Report Inappropriate Content
Do you need a table? Or that exact graphic. That EXACT graphic is not a QlikSense graphic, but is a QlikView graphic.
- Mark as New
- Bookmark
- Subscribe
- Mute
- Subscribe to RSS Feed
- Permalink
- Report Inappropriate Content
Probably the below one?
- Mark as New
- Bookmark
- Subscribe
- Mute
- Subscribe to RSS Feed
- Permalink
- Report Inappropriate Content
Um...okay. So what you are trying to replicate can't be done in QlikSense. The page you linked to, no offense to OG Bensalem, is a hack. It's not a native component. The saving grace on that page is that it's a simple bar, not a line chart which would be far more complicated and obnoxious to get done in the same manner.
There might be an extension out there somewhere, and while I've never seen it, I've never gone looking for it either.
If you find it, don't hesitate to let us know. Oh, also, It's too dangerous to go alone take this Qlik Branch
- Mark as New
- Bookmark
- Subscribe
- Mute
- Subscribe to RSS Feed
- Permalink
- Report Inappropriate Content
Hi Alonso,
It's also known as a sparkline. This extension may be of help:
GitHub - mwz05github/DynamicTableSparkline: Qlik Sense Dynamic Table with Sparklines
- Mark as New
- Bookmark
- Subscribe
- Mute
- Subscribe to RSS Feed
- Permalink
- Report Inappropriate Content
I saw that too, but the fact the repo hasn't been touched since 2016 made me worry a little bit.
- Mark as New
- Bookmark
- Subscribe
- Mute
- Subscribe to RSS Feed
- Permalink
- Report Inappropriate Content
Yeah, it looked a tad dated, but also looked like it might be adequate for what Alonso needed for his assignment. Hopefully, Alsonso will be able get some value from it.
- Mark as New
- Bookmark
- Subscribe
- Mute
- Subscribe to RSS Feed
- Permalink
- Report Inappropriate Content
Yes I need to recreate that exact table using Qlik Sense.
- Mark as New
- Bookmark
- Subscribe
- Mute
- Subscribe to RSS Feed
- Permalink
- Report Inappropriate Content
This mini chart you mention is interesting but I think is not exactly de one that I'm being requested to do.
thanks @S Khan
- Mark as New
- Bookmark
- Subscribe
- Mute
- Subscribe to RSS Feed
- Permalink
- Report Inappropriate Content
Take a look at this:
- « Previous Replies
-
- 1
- 2
- Next Replies »