Unlock a world of possibilities! Login now and discover the exclusive benefits awaiting you.
- Qlik Community
- :
- Forums
- :
- Analytics
- :
- New to Qlik Analytics
- :
- Re: count of unique values inside the period
- Subscribe to RSS Feed
- Mark Topic as New
- Mark Topic as Read
- Float this Topic for Current User
- Bookmark
- Subscribe
- Mute
- Printer Friendly Page
- Mark as New
- Bookmark
- Subscribe
- Mute
- Subscribe to RSS Feed
- Permalink
- Report Inappropriate Content
count of unique values inside the period
Hello,
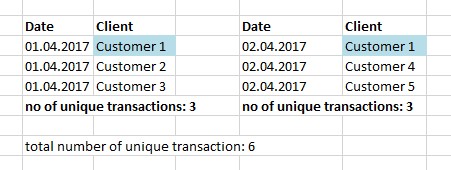
I have a list of transaction per day, split by customers. One customer can buy more than one time within a time period.
I want to count unique transaction.
When i choose a MONTH_YEAR in a filter, my formula gives me correct number of transaction:
sum( AGGR ( count(Client) ,Date ) ) = 6.
When I choose DATE as a filter (for example 01 and 02 of April) , it returns the wrong result.
I tried to reverse the formula: sum( AGGR ( count(Date) ,Client ) ) , and it works fine both with MONTH_YEAR and DATE filters, but when I build a PIVOT with Client as ROW and MONTH_YEAR as column, it won't work (it works only with the simple formula count (client) )
What's wrong?
My data as an example:

- Mark as New
- Bookmark
- Subscribe
- Mute
- Subscribe to RSS Feed
- Permalink
- Report Inappropriate Content
hi
if you want to count unique transaction , if i understand correctly you want to count all the rows in the table
so why can't you use count(client) for all levels of displays
- Mark as New
- Bookmark
- Subscribe
- Mute
- Subscribe to RSS Feed
- Permalink
- Report Inappropriate Content
it works if my dimension is DATE
it does not work without dimension
thus, if i use KPI which shows number of purchases for whenever period, i have to explicitly state that it should first aggregate the purchases by date and then sum them up.
It works fine until i want to use this KPI as measure with MONTHS as dimension, and i don't realize why.
- Mark as New
- Bookmark
- Subscribe
- Mute
- Subscribe to RSS Feed
- Permalink
- Report Inappropriate Content
I think Liron is asking - why can't use just use =count(distinct Client) without aggr.
Or even something like =count(distinct Client & Date)
- Mark as New
- Bookmark
- Subscribe
- Mute
- Subscribe to RSS Feed
- Permalink
- Report Inappropriate Content
because unless I use DATE as dimension, count(client) will merge all purchase occurrences from a single client in one single purchase.
count (date) will work only if the dimension is CLIENT. If not, it will return number of days in a given period.
- Mark as New
- Bookmark
- Subscribe
- Mute
- Subscribe to RSS Feed
- Permalink
- Report Inappropriate Content
I understand what you're saying now. It would be helpful if you had a sample app to share?
- Mark as New
- Bookmark
- Subscribe
- Mute
- Subscribe to RSS Feed
- Permalink
- Report Inappropriate Content
Unfortunately it is not possible - I'd have to spend hours to create a small sample of my original data.
I think I would be using the sum( AGGR ( count(Client) ,Date ) ) as it works for me, at least for now.
Thank you!