Unlock a world of possibilities! Login now and discover the exclusive benefits awaiting you.
- Qlik Community
- :
- Forums
- :
- Analytics
- :
- New to Qlik Analytics
- :
- Re: creating a text box that displays the filter s...
- Subscribe to RSS Feed
- Mark Topic as New
- Mark Topic as Read
- Float this Topic for Current User
- Bookmark
- Subscribe
- Mute
- Printer Friendly Page
- Mark as New
- Bookmark
- Subscribe
- Mute
- Subscribe to RSS Feed
- Permalink
- Report Inappropriate Content
creating a text box that displays the filter selections
Hi,
I am relatively new to Qlik Sense and i am producing a dashboard for a view of different KPIs. I was told there was a function that i could use within a text box perhaps at the bottom of the sheet that would display each of the criteria that a user has selected. My goal is for the user to tell from a snapshot exactly what fields/criteria is contributing to each metric (without having to look at the green selected items in each drop-down). I would like for the user to see a snapshot of the dashboard and be able to tell for instance that they are looking at sales and margin for x,y,z retailers in oct,nov,and dec of 2014. Any help would be greatly appreciated!
Thanks!
- Tags:
- qlik sense
- « Previous Replies
-
- 1
- 2
- Next Replies »
Accepted Solutions
- Mark as New
- Bookmark
- Subscribe
- Mute
- Subscribe to RSS Feed
- Permalink
- Report Inappropriate Content
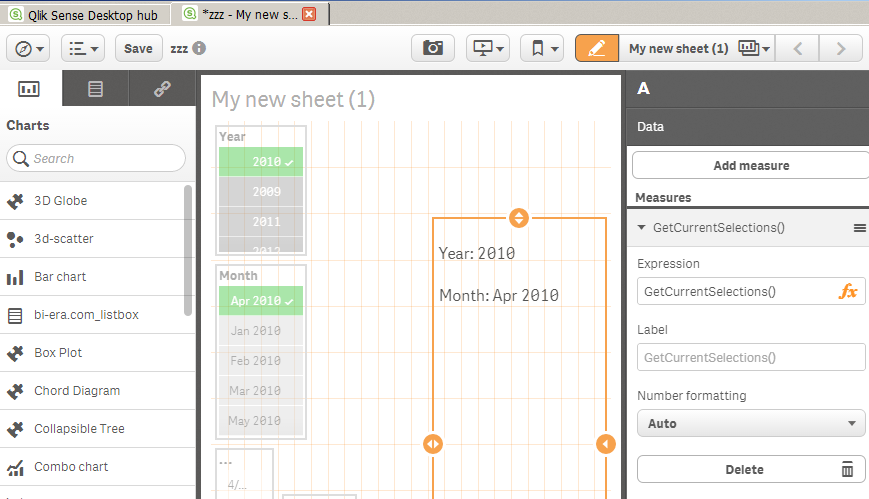
sam, create a brand new text box. Add one measure as follows:
if(getselectedcount(Year)>0,'Year: ' & concat(distinct Year,', '))
...where Year is a field in your data model. Try to apply a selection and watch what happens. It shows the selection for Year. You would need to repeat for some or all of the other fields. It is probably exhaustive but it can give you finer level control if you only want to show a subset. getfieldselections() shows all of them ...period.
Please also note that you can influence the number of points where getfieldselections() shows a list of selected values instead of x of y values.
getfieldselections ( FieldName [, ValueSep [, MaxValues [, State]]])
You can enter a value for the 3rd argument to raise this to 20, 50, 100 etc..
Does this help clarify things ?
- Mark as New
- Bookmark
- Subscribe
- Mute
- Subscribe to RSS Feed
- Permalink
- Report Inappropriate Content
Within qlikview you could take getcurrentselections() for this. By Sense I'm not sure if it available.
- Marcus
- Mark as New
- Bookmark
- Subscribe
- Mute
- Subscribe to RSS Feed
- Permalink
- Report Inappropriate Content
it is.
You can also fine tune it using a series of measures spaced out using: concat( distinct <fieldname>,', ' )
- Mark as New
- Bookmark
- Subscribe
- Mute
- Subscribe to RSS Feed
- Permalink
- Report Inappropriate Content
thanks for the quick response! i'm trying to use the concatenate function you suggested to list out the years, but i keep getting an "error in expression '>' expected" when i try to create it... is that function to be used along with the getcurrentselections function? Any idea what i am doing wrong?
- Mark as New
- Bookmark
- Subscribe
- Mute
- Subscribe to RSS Feed
- Permalink
- Report Inappropriate Content
separately or at least in a different measure.
also its not concatenate, its concat(). can you post your syntax for review.
- Mark as New
- Bookmark
- Subscribe
- Mute
- Subscribe to RSS Feed
- Permalink
- Report Inappropriate Content
concat(distinct<YYYY/MM>,',')
right now it's showing 11 of 36 for the YYYY/MM field and i wanted to see how it would look to list them out within the text box
also, i have a region field and it has "NOT". i'm not sure what that means.
- Mark as New
- Bookmark
- Subscribe
- Mute
- Subscribe to RSS Feed
- Permalink
- Report Inappropriate Content
i also tried getcurrentselections(concat(distinct<YYYY/MM>,',')) and it did not work
- Mark as New
- Bookmark
- Subscribe
- Mute
- Subscribe to RSS Feed
- Permalink
- Report Inappropriate Content
For the <> i was just using it as shorthand. If YYYY/MM is the actual field name, wrap it in []. I also changed ',' to ', ' for better spacing
concat(distinct [YYYY/MM],', ')
- Mark as New
- Bookmark
- Subscribe
- Mute
- Subscribe to RSS Feed
- Permalink
- Report Inappropriate Content
this works but it adds the listed dates to the end of the last selection in the text box instead of listing after the YYYY/MM column which is where i would like it displayed
- Mark as New
- Bookmark
- Subscribe
- Mute
- Subscribe to RSS Feed
- Permalink
- Report Inappropriate Content
sam, create a brand new text box. Add one measure as follows:
if(getselectedcount(Year)>0,'Year: ' & concat(distinct Year,', '))
...where Year is a field in your data model. Try to apply a selection and watch what happens. It shows the selection for Year. You would need to repeat for some or all of the other fields. It is probably exhaustive but it can give you finer level control if you only want to show a subset. getfieldselections() shows all of them ...period.
Please also note that you can influence the number of points where getfieldselections() shows a list of selected values instead of x of y values.
getfieldselections ( FieldName [, ValueSep [, MaxValues [, State]]])
You can enter a value for the 3rd argument to raise this to 20, 50, 100 etc..
Does this help clarify things ?
- « Previous Replies
-
- 1
- 2
- Next Replies »