Unlock a world of possibilities! Login now and discover the exclusive benefits awaiting you.
- Qlik Community
- :
- Forums
- :
- Analytics
- :
- New to Qlik Analytics
- :
- cumulative count based on CREATED_MONTH
- Subscribe to RSS Feed
- Mark Topic as New
- Mark Topic as Read
- Float this Topic for Current User
- Bookmark
- Subscribe
- Mute
- Printer Friendly Page
- Mark as New
- Bookmark
- Subscribe
- Mute
- Subscribe to RSS Feed
- Permalink
- Report Inappropriate Content
cumulative count based on CREATED_MONTH
Hi All - i am loading data whereby all records have a CREATED_MONTH derived as part of the load. e.g.
USER_ID,
CREATED_DATETIME,
Date(Date#(CREATED_DATETIME,'YYYY-MM-DD hh.mm.ss'),'DD/MM/YYYY') AS CREATED_DATE,
MonthName(timestamp#(CREATED_DATETIME,'YYYY-MM-DD hh.mm.ss')) as CREATED_MONTH
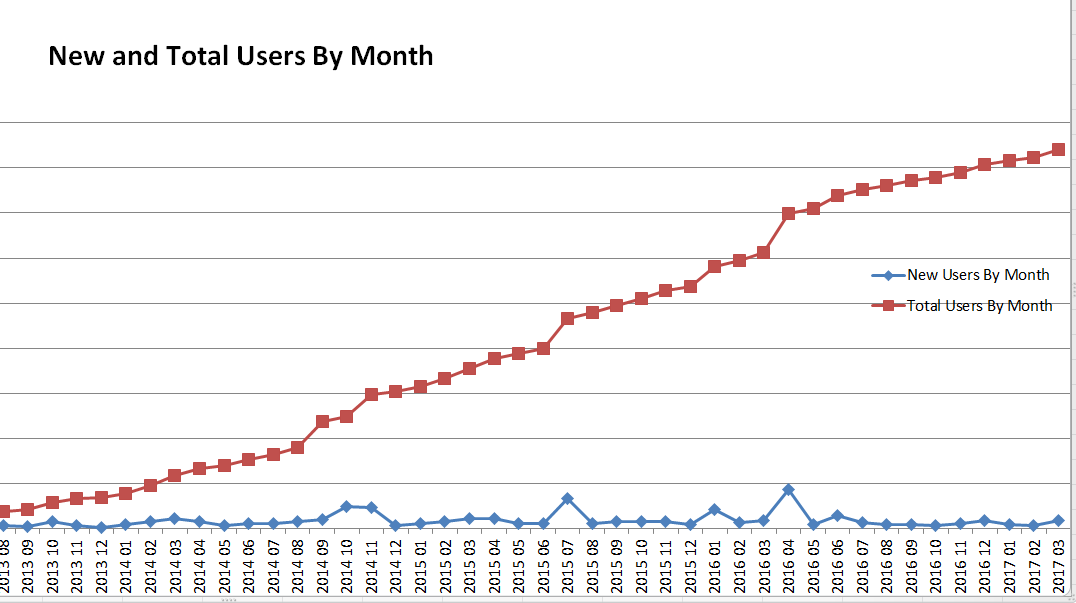
I wish to create a line graph which shows 2 tracked measures e.g. USER_UD created each month and accumulated count of USER_IDs per month. obviously i can just do a count of user_ids based on created_month but how do i create a cumulative value.
Am not sure whether of the expression.
So it would look something like this.
Any help appreciated. Also I wasnt sure whether it was best to include as part of the load script to generate a new table or within the expression of the graph.
Thanks
Martin
Accepted Solutions
- Mark as New
- Bookmark
- Subscribe
- Mute
- Subscribe to RSS Feed
- Permalink
- Report Inappropriate Content
As Dimension:
Created_Month
As measures:
Measure 1 : count(USER_ID)
Measure 2(cumulative): rangesum(above(count(USER_ID),0,rowno())
- Mark as New
- Bookmark
- Subscribe
- Mute
- Subscribe to RSS Feed
- Permalink
- Report Inappropriate Content
As Dimension:
Created_Month
As measures:
Measure 1 : count(USER_ID)
Measure 2(cumulative): rangesum(above(count(USER_ID),0,rowno())