Unlock a world of possibilities! Login now and discover the exclusive benefits awaiting you.
- Qlik Community
- :
- Forums
- :
- Analytics
- :
- New to Qlik Analytics
- :
- Re: filter for each visualization on one page
- Subscribe to RSS Feed
- Mark Topic as New
- Mark Topic as Read
- Float this Topic for Current User
- Bookmark
- Subscribe
- Mute
- Printer Friendly Page
- Mark as New
- Bookmark
- Subscribe
- Mute
- Subscribe to RSS Feed
- Permalink
- Report Inappropriate Content
filter for each visualization on one page
Hi everyone,
i´m very new to qlik sense:
Is it possible to implement filter for several visualizations? if i have 3 bar charts on one page and i want to filter each bar chart with a different filter.
thanks for your help!
- « Previous Replies
-
- 1
- 2
- Next Replies »
Accepted Solutions
- Mark as New
- Bookmark
- Subscribe
- Mute
- Subscribe to RSS Feed
- Permalink
- Report Inappropriate Content
With the use of an alternate state you can achive this.
You can download your alternate state extension from Qlik Branch.
- Mark as New
- Bookmark
- Subscribe
- Mute
- Subscribe to RSS Feed
- Permalink
- Report Inappropriate Content
You will need to be a bit more specific I think. At first blush, you would have to use set analysis to filter each chart by a separate set of filters. You will need to use the $, $-1, and -1 in the set definition to do this.. Check out this page by Fabrice Aunez on this...
- Mark as New
- Bookmark
- Subscribe
- Mute
- Subscribe to RSS Feed
- Permalink
- Report Inappropriate Content
Hi
I either
Set up favorities for the different options or
Just select the appropriate filter(s)
Or use set analysis to include the filter(s) in the expression
- Mark as New
- Bookmark
- Subscribe
- Mute
- Subscribe to RSS Feed
- Permalink
- Report Inappropriate Content
Hi,
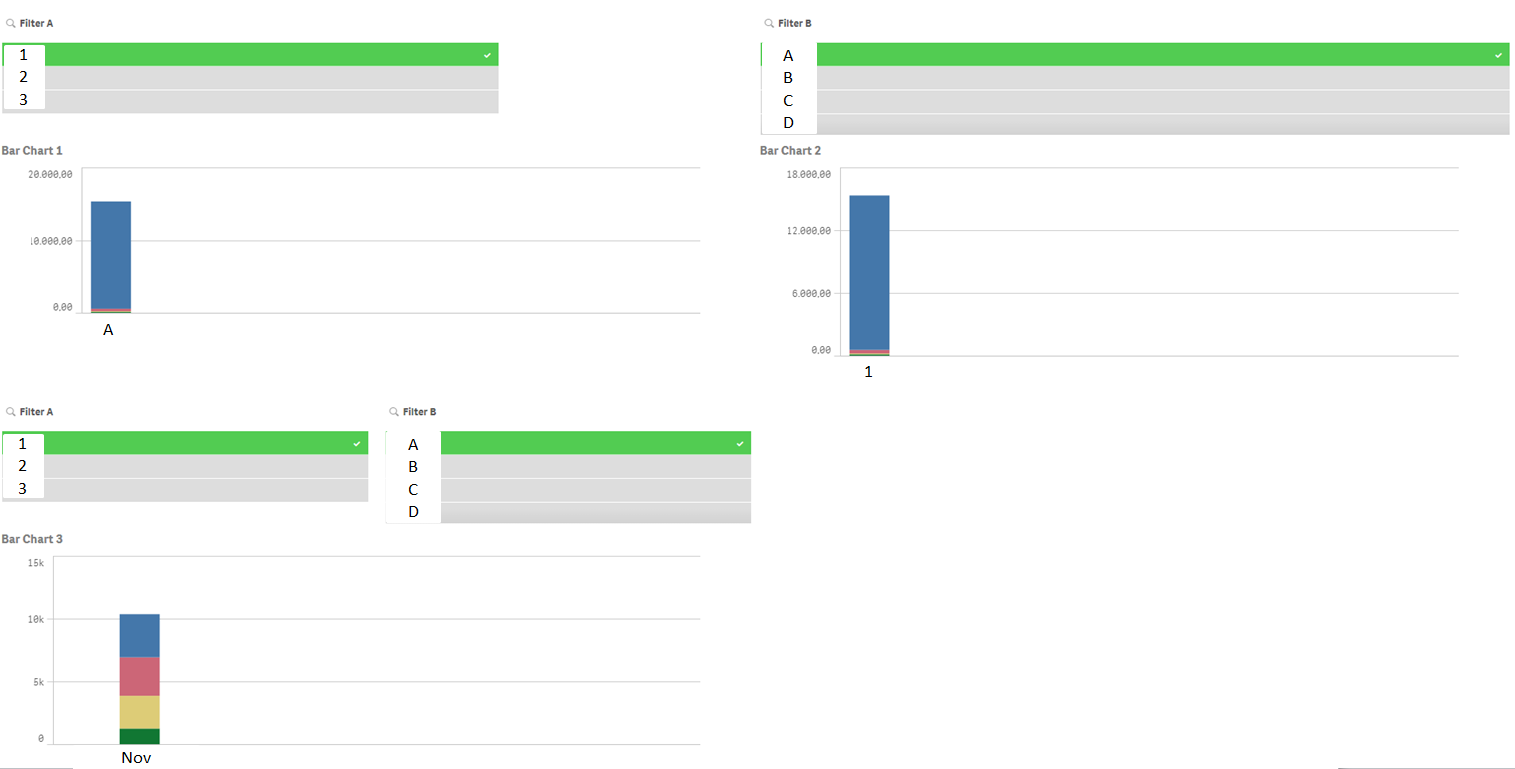
to be more precise I´ve added a snapshot:
I have 2 filters A and B and 3 bar charts. For each bar chart I want to add a separate filter. For example bar chart 1 should only react to filter A, bar chart 2 to filter B and bar chart 3 to filter A + B.
And most important: If I select value 1 in above filter A, filter A below shouldn´t react on it! It should be possible to filter independently from each other.
Thank you in advance!
- Mark as New
- Bookmark
- Subscribe
- Mute
- Subscribe to RSS Feed
- Permalink
- Report Inappropriate Content
you should use set analysis in your chart expressions as below:
ex. for bar chart 1 filter A: Sum( {1< Filter_A=$::Filter_A >} your_measure )
ex. for bar chart 2 filter B: Sum( {1< Filter_B=$::Filter_B >} your_measure )
ex. for bar chart 3 filter A+B: Sum( {1< Filter_A=$::Filter_A, Filter_B=$::Filter_B >} your_measure )
- Mark as New
- Bookmark
- Subscribe
- Mute
- Subscribe to RSS Feed
- Permalink
- Report Inappropriate Content
Hi,
i´ve used the expression. But if I select a value in filter A for bar chart 1 it adopts the same value for bar chart 3 below. But the filter panes for each bar chart should be able to filter their own value.
- Mark as New
- Bookmark
- Subscribe
- Mute
- Subscribe to RSS Feed
- Permalink
- Report Inappropriate Content
With the use of an alternate state you can achive this.
You can download your alternate state extension from Qlik Branch.
- Mark as New
- Bookmark
- Subscribe
- Mute
- Subscribe to RSS Feed
- Permalink
- Report Inappropriate Content
you'd need a separate filters/fields for bar chart 3 (ex Filter AA, Filter BB with the same values of Filter A, Filter B) not the same used for above bar charts A and B.
otherwise you should use alternate states extension at Qlik Branch
- Mark as New
- Bookmark
- Subscribe
- Mute
- Subscribe to RSS Feed
- Permalink
- Report Inappropriate Content
Perhaps a data island? It sounds like you have a number of visualizations that you want the user to interact with, independent of the filters of the normal data model. This thread may be helpful:
- Mark as New
- Bookmark
- Subscribe
- Mute
- Subscribe to RSS Feed
- Permalink
- Report Inappropriate Content
Hi,
thank you for your answer. I used Alternate State and it works. But is it possible to use one more filter for the entire report page? Attached you´ll find it more specific. I´ll have month-filter which stands "above" the others and works like a parent filter.
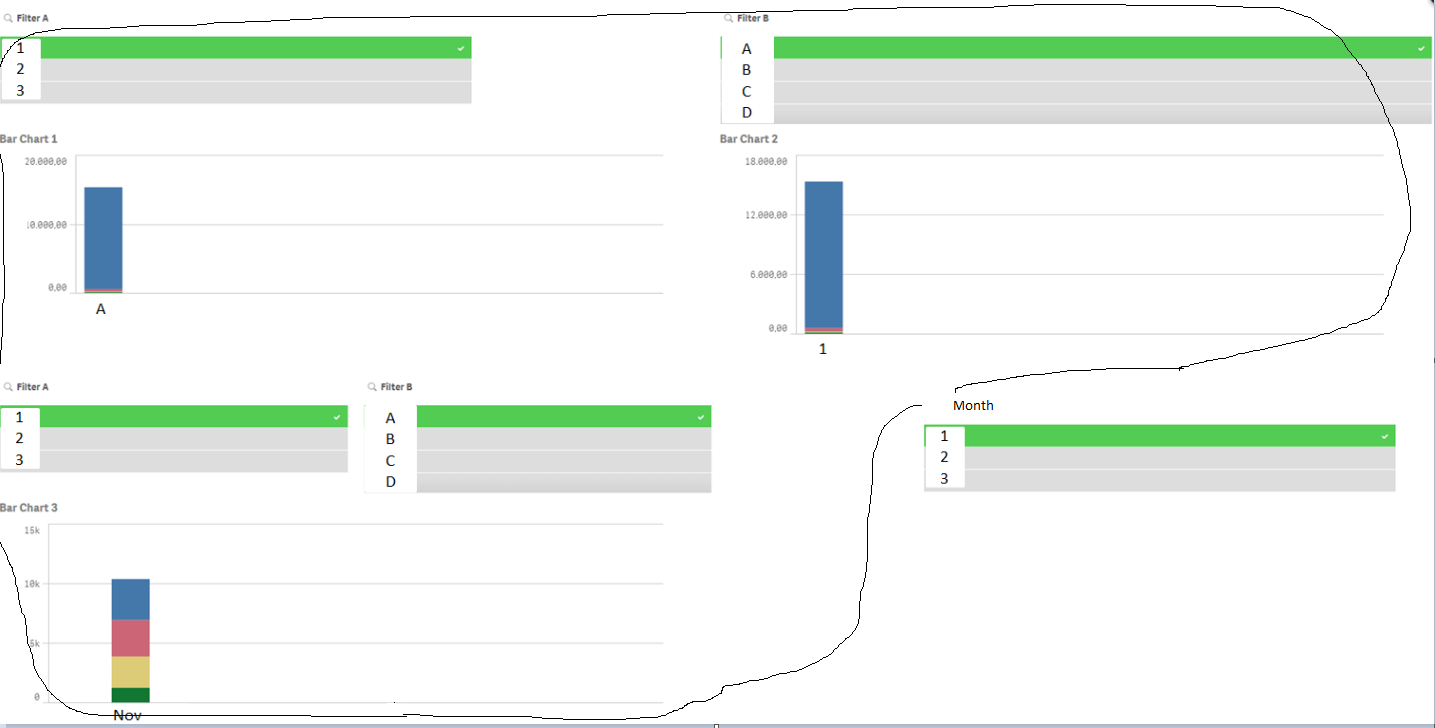
Best Regards
- « Previous Replies
-
- 1
- 2
- Next Replies »