Unlock a world of possibilities! Login now and discover the exclusive benefits awaiting you.
- Qlik Community
- :
- Forums
- :
- Analytics
- :
- New to Qlik Analytics
- :
- Re: how do display all possible dimension after se...
- Subscribe to RSS Feed
- Mark Topic as New
- Mark Topic as Read
- Float this Topic for Current User
- Bookmark
- Subscribe
- Mute
- Printer Friendly Page
- Mark as New
- Bookmark
- Subscribe
- Mute
- Subscribe to RSS Feed
- Permalink
- Report Inappropriate Content
how do display all possible dimension after selection
Hi all,
I am working on a chart that present phone brand as dimension and brand share among users as measures.
I want to have the following features
- only report brand where at least two users are using it
- use GetSelectCount(month_id) to indicate whether there is a selection of month_id
- if no month_id is selected, display the latest month data
- if one month_id is selected, display the data for selected month (only one month will be selected)
- when one brand selection is made, instead of presenting the selection with share 100%, display all other possible brand dimension
for the fourth point, for example. If I select brand Samsung, instead of only presenting Samsung with measure = 100%.
It would be like this.
Samsung 100%
Apple 66%
Reason for the shares above is that all three users in month_id = 1 users Samsung. And two of them also has Apple. Brand Blackberry is not showing because it only has one user.
My expression:
Aggr(
If(
Count( DISTINCT
{1<user= P({$<month_id = $(=IF(GetSelectedCount(month_id) = 0,'{$(=Max(month_id))}','P({$} month_id)')) >}) >} user) > 1,
brand),
brand)
| month_id | user | brand |
| 1 | A | Apple |
| 1 | A | Samsung |
| 1 | B | Samsung |
| 1 | B | Balckberry |
| 1 | C | Samsung |
| 1 | C | Apple |
Thanks in advance for the help.
Accepted Solutions
- Mark as New
- Bookmark
- Subscribe
- Mute
- Subscribe to RSS Feed
- Permalink
- Report Inappropriate Content
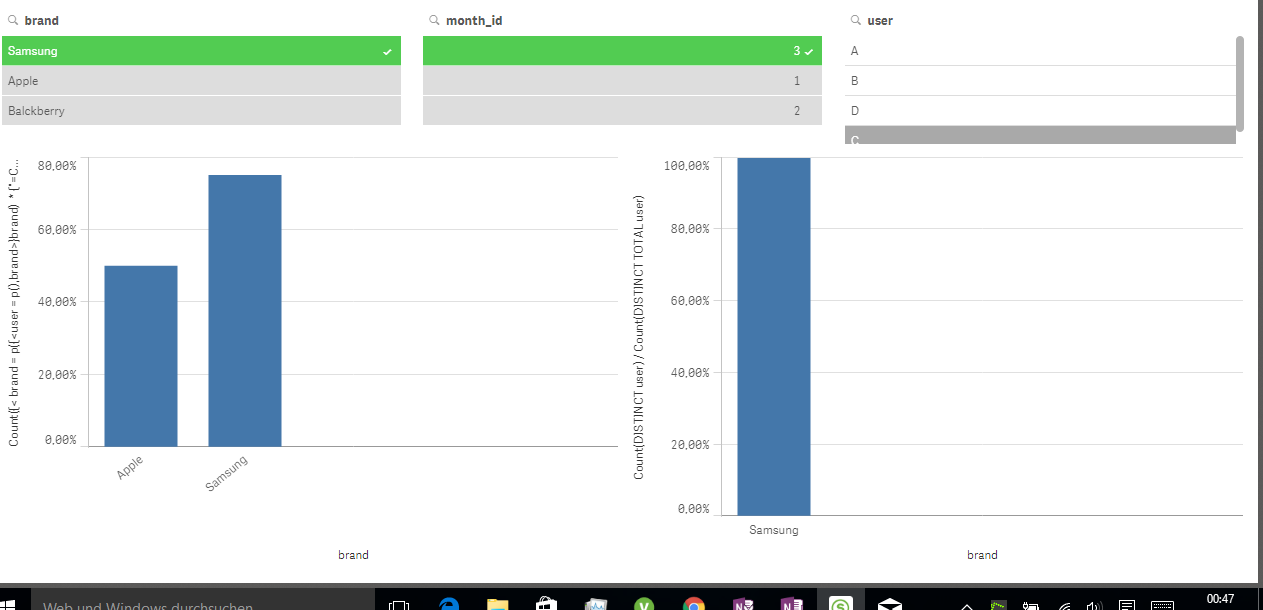
It would be easier to work on possible solutions if you could upload a small sample QVF.
It's also not 100% clear if you want to count the users per brand (constraint 1.) for the respective month range defined in 2.-4. or across the entire data set.
Hence, it would be good to add some sample selections and expected results.
I've come up with a set expression like
{<
brand = p({<user = p(),brand>}brand)
*
{"=Count(DISTINCT {1<month_id =
$(=IF(GetSelectedCount(month_id) = 0,'{$(=Max(month_id))}','P({$} month_id)')) >} user) > 1"}
,month_id =
$(=IF(GetSelectedCount(month_id) = 0,'{$(=Max(month_id))}','P({$} month_id)'))
>}
and used this set expression in all aggregation functions.
Dimension would be just brand.
See attached a sample (left bar chart with suggested solution, right bar chart using the set expression in a calculated dimension, to demonstrate potential differences).
- Mark as New
- Bookmark
- Subscribe
- Mute
- Subscribe to RSS Feed
- Permalink
- Report Inappropriate Content
Hey
Thanks again.
This is very helpful 