Unlock a world of possibilities! Login now and discover the exclusive benefits awaiting you.
- Qlik Community
- :
- Forums
- :
- Analytics
- :
- New to Qlik Analytics
- :
- Re: how to add a two measure value to the same dim...
- Subscribe to RSS Feed
- Mark Topic as New
- Mark Topic as Read
- Float this Topic for Current User
- Bookmark
- Subscribe
- Mute
- Printer Friendly Page
- Mark as New
- Bookmark
- Subscribe
- Mute
- Subscribe to RSS Feed
- Permalink
- Report Inappropriate Content
how to add a two measure value to the same dimension
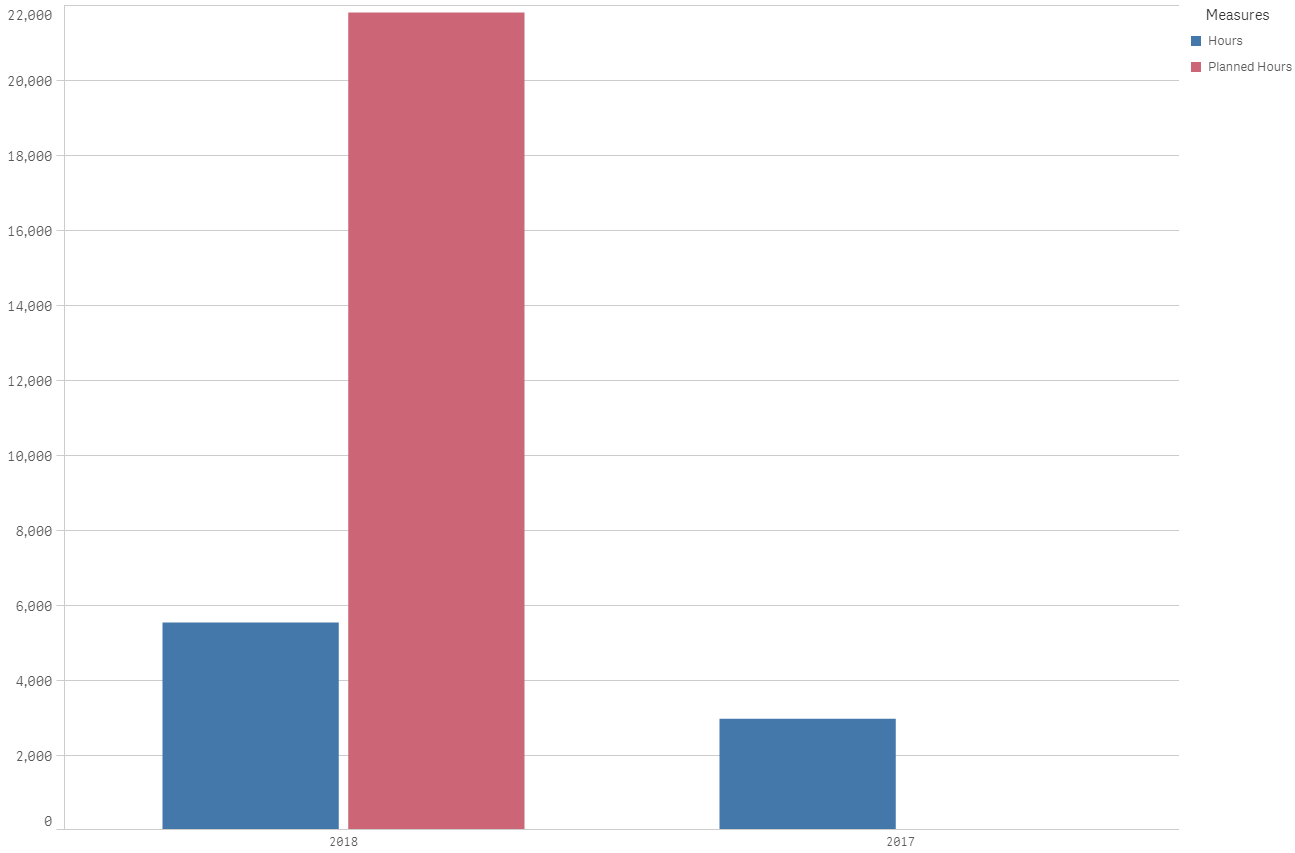
I have a plan of projects for 2018 (red), I also have charged time for 2018 (Blue)
I have an issue because we have some projects from 2017 that charged in 2018 (projects from last year that carried over). I want to show how many hours have been used this year in comparison to the hours we have planned for projects this year. So I want the total of hours charged this year in comparison with projects planned for this year
TLDR: I want the two blue bars summed and represented next to the red bar with only the 2018 dimension showing.
Any help would be great!
Accepted Solutions
- Mark as New
- Bookmark
- Subscribe
- Mute
- Subscribe to RSS Feed
- Permalink
- Report Inappropriate Content
So I figured out a way in which it would work for my situation.
I combined the dimensions using an expression. Basically if my year equaled 2017 or 2016 I made the if statement reassign them to 2018.
This showed all my data in one dimension.
=if(Year='2017','2018',if(Year='2016','2018','2018'))