Unlock a world of possibilities! Login now and discover the exclusive benefits awaiting you.
- Qlik Community
- :
- Forums
- :
- Analytics
- :
- New to Qlik Analytics
- :
- Re: line graph for every Two months
- Subscribe to RSS Feed
- Mark Topic as New
- Mark Topic as Read
- Float this Topic for Current User
- Bookmark
- Subscribe
- Mute
- Printer Friendly Page
- Mark as New
- Bookmark
- Subscribe
- Mute
- Subscribe to RSS Feed
- Permalink
- Report Inappropriate Content
line graph for every Two months
Hi all,
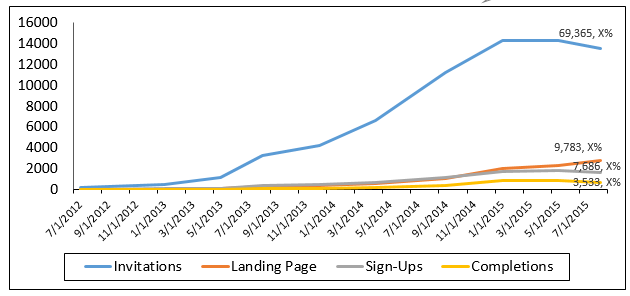
I need to display line graph as below.

From the start date in the table to today's date i need to display data for two months once.
I am using canonical date as dimension what need to change.
Measures:
Count({$<DateType = {invitation}>}invitation_id)
Count({$<DateType={accessed}>}invitation_id)
count({$<user_signed={1},DateType={signed}>}user_signed)
Regards,
Pramod
- Tags:
- linechart
- « Previous Replies
-
- 1
- 2
- Next Replies »
- Mark as New
- Bookmark
- Subscribe
- Mute
- Subscribe to RSS Feed
- Permalink
- Report Inappropriate Content
you are missing single quote in set analysis
{'Value'}
Also you need to use SetAnalysis, AddMonths(Today(),-1)
Provide sample data, would try for you...!
- Mark as New
- Bookmark
- Subscribe
- Mute
- Subscribe to RSS Feed
- Permalink
- Report Inappropriate Content
AddMonths(Today(),-1) is not working.
- Mark as New
- Bookmark
- Subscribe
- Mute
- Subscribe to RSS Feed
- Permalink
- Report Inappropriate Content
Try like this
Try this expression
if(mod(YourDateDimension,2)=0,YourDateDiemnsion,Null())
Then untick the Show Null Values box
Feeling Qlikngry?
- Mark as New
- Bookmark
- Subscribe
- Mute
- Subscribe to RSS Feed
- Permalink
- Report Inappropriate Content
provide data in excel file along with your desired result...
- Mark as New
- Bookmark
- Subscribe
- Mute
- Subscribe to RSS Feed
- Permalink
- Report Inappropriate Content
Hi Mika,
if(mod(CanonicalDate,2)=0,CanonicalDate,Null())
I am providing like above, it is displaying two days not two months, please help where i am doing wrong
- Mark as New
- Bookmark
- Subscribe
- Mute
- Subscribe to RSS Feed
- Permalink
- Report Inappropriate Content
Maybe
=if(mod(num(Year(CanonicalDate)))&num(Month(CanonicalDate))),2)=0,num(Year(CanonicalDate)))&num(Month(CanonicalDate))),2)
- Mark as New
- Bookmark
- Subscribe
- Mute
- Subscribe to RSS Feed
- Permalink
- Report Inappropriate Content
Hi Robert Mika,
Once you check with the brackets '(' it's showing error in expression.
I am not getting where to add the brackets.
- Mark as New
- Bookmark
- Subscribe
- Mute
- Subscribe to RSS Feed
- Permalink
- Report Inappropriate Content
Sorry my bad:
=if(mod(num(Year(CanonicalDate))&num(Month(CanonicalDate)),2)=0,num(Year(CanonicalDate))&num(Month(CanonicalDate)),NULL())
- Mark as New
- Bookmark
- Subscribe
- Mute
- Subscribe to RSS Feed
- Permalink
- Report Inappropriate Content
Hi Robert Mika,
Thanks it's getting but small issue, It,s not in the order and not in the date format "MM-DD-YYYY".
You can see the image. 2012 value is coming between 2014 and 2015
Please help to correct it
- « Previous Replies
-
- 1
- 2
- Next Replies »