Unlock a world of possibilities! Login now and discover the exclusive benefits awaiting you.
- Qlik Community
- :
- Forums
- :
- Analytics
- :
- New to Qlik Analytics
- :
- Re: show the same measure values for two different...
- Subscribe to RSS Feed
- Mark Topic as New
- Mark Topic as Read
- Float this Topic for Current User
- Bookmark
- Subscribe
- Mute
- Printer Friendly Page
- Mark as New
- Bookmark
- Subscribe
- Mute
- Subscribe to RSS Feed
- Permalink
- Report Inappropriate Content
show the same measure values for two different dimensions
Hi All,
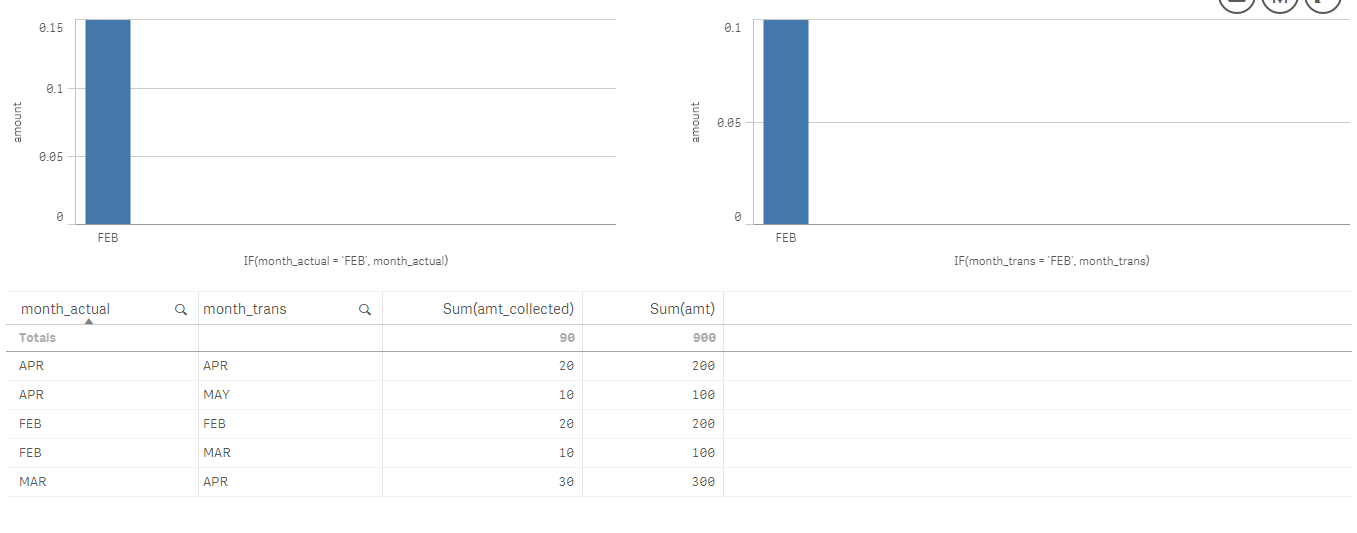
In the attached image there are two bar charts and the table below shows the data loaded in my app. I have replicated a simple scenario in my attached app to get a solution.
Both my bar charts have the same measures, but the dimension which is a time period differs.
I need a solution which can show the same measure values for both dimension (i.e. month_actual and month_trans). Is this possible by writing set analysis in the dimension expression? or is there any other way i can achieve it
- Mark as New
- Bookmark
- Subscribe
- Mute
- Subscribe to RSS Feed
- Permalink
- Report Inappropriate Content
Hi,
Here is the solution. Please find the attached application. Writing Set Analysis is the best way to achieve it.
- Mark as New
- Bookmark
- Subscribe
- Mute
- Subscribe to RSS Feed
- Permalink
- Report Inappropriate Content
Thanks for the quick reply.
In your app you have changed both the measures. I need this to be in both my measures
sum({<month_actual={'FEB'}>}amt_collected)
/
sum({<month_trans={'FEB'}>}amt)
Although my second bar has "month_trans" as its dimension, i want it to contain "month_actual" values too
Regards,
Janani
- Mark as New
- Bookmark
- Subscribe
- Mute
- Subscribe to RSS Feed
- Permalink
- Report Inappropriate Content
Please find the application.