Unlock a world of possibilities! Login now and discover the exclusive benefits awaiting you.
- Qlik Community
- :
- Forums
- :
- Analytics
- :
- New to Qlik Analytics
- :
- significant time slot
- Subscribe to RSS Feed
- Mark Topic as New
- Mark Topic as Read
- Float this Topic for Current User
- Bookmark
- Subscribe
- Mute
- Printer Friendly Page
- Mark as New
- Bookmark
- Subscribe
- Mute
- Subscribe to RSS Feed
- Permalink
- Report Inappropriate Content
significant time slot
Hello ,
I calculated a processing time for a transport and then I calculated for each time how much I have transport, that is to say for a delay of one minute how much I have transport, two minutes and so right now .
What we want to do is to define non-regular time slots each time. Interval of 2 seconds and others of an hour ...
I hope I explained my problem well. tell me if you need more details.
Accepted Solutions
- Mark as New
- Bookmark
- Subscribe
- Mute
- Subscribe to RSS Feed
- Permalink
- Report Inappropriate Content
Ok
First you need to specify the dimensions for the graph. Either by a valuelist directly in the chart, by an inline load in the script or use an Excel file to manage dimensions and limits for different charts.
If you want to define it in each graph you probably will use a valuelist. Let's say valuelist('<00:01:00','00:01:00-01:00:00','>01:00:00'), only 3 intervals to keep it simple.
Your calculation should be
if(valuelist('<00:01:00','00:01:00-01:00:00','>01:00:00')='<00:01:00',Sum( {$<time={"<=00:01:00"}>} value),
if(valuelist('<00:01:00','00:01:00-01:00:00','00:01:00-01:00:00')='<00:01:00',Sum( {$<time={">00:01:00<=01:00:00"}>} value),
Sum( {$<time={">01:00:00"}>} value)
))
Your sorting formula is
Match(valuelist('<00:01:00','00:01:00-01:00:00','>01:00:00'),'<00:01:00','00:01:00-01:00:00','>01:00:00')
With my testdata I get this bar chart
You can also make it a little bit more dynamic by defining your range limits as variables
To illustrate I defined
vRange1 = 00:00:10
vRange2 = 00:01:00
vRange3 = 01:00:00
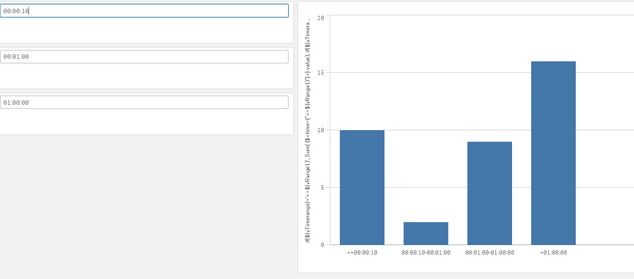
This gives us 4 ranges, <Range1, Range1-Range2, Range2-Range3 and >Range3
Define a variable vTimerange as valuelist('<=$(vRange1)','$(vRange1)-$(vRange2)','$(vRange2)-$(vRange3)','>$(vRange3)')
Then I use $(vTimerange) as dimension and this calculation
if($(vTimerange)='<=$(vRange1)', Sum( {$<time={"<=$(vRange1)"}>} value),
if($(vTimerange)='$(vRange1)-$(vRange2)', Sum( {$<time={">$(vRange1)<=$(vRange2)"}>} value),
if($(vTimerange)='$(vRange2)-$(vRange3)', Sum( {$<time={">$(vRange2)<=$(vRange3)"}>} value),
Sum( {$<time={">$(vRange3)"}>} value)
)))
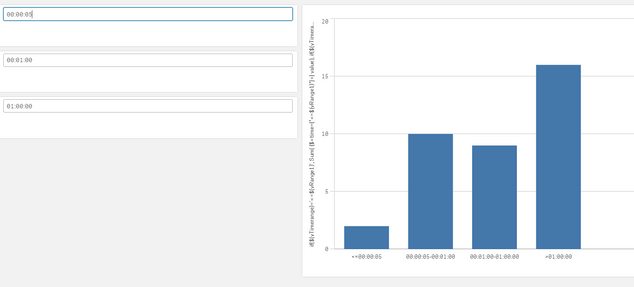
Below you see the outcome and what happens if I change my vRange variable input to 00:00:05
I understand you probably don't want your users to change ranges, but it's a good idea to use variables anyways as it gets very messy otherwise when adding more and more intervals.
Hope this gets you in the right direction.
(Probably some errors with </<= in my calculations, be more careful than I was)
- Mark as New
- Bookmark
- Subscribe
- Mute
- Subscribe to RSS Feed
- Permalink
- Report Inappropriate Content
If I understandyou correctly you need to use intervalmatch:
https://help.qlik.com/en-US/sense/May2021/Subsystems/Hub/Content/Sense_Hub/Scripting/ScriptPrefixes/...
- Mark as New
- Bookmark
- Subscribe
- Mute
- Subscribe to RSS Feed
- Permalink
- Report Inappropriate Content
i tried this but it doesn't work when i add 00:00:00 <x<00:10:00
- Mark as New
- Bookmark
- Subscribe
- Mute
- Subscribe to RSS Feed
- Permalink
- Report Inappropriate Content
I don't understand the link, was it correct? Had nothing with intervalmatch to do.
How is your intervalmatch load scripted?
- Mark as New
- Bookmark
- Subscribe
- Mute
- Subscribe to RSS Feed
- Permalink
- Report Inappropriate Content
I want to define the time slots directly for each graph because it is not applicable for all cases.
I don't want to define them in the loading script
- Mark as New
- Bookmark
- Subscribe
- Mute
- Subscribe to RSS Feed
- Permalink
- Report Inappropriate Content
Ok
First you need to specify the dimensions for the graph. Either by a valuelist directly in the chart, by an inline load in the script or use an Excel file to manage dimensions and limits for different charts.
If you want to define it in each graph you probably will use a valuelist. Let's say valuelist('<00:01:00','00:01:00-01:00:00','>01:00:00'), only 3 intervals to keep it simple.
Your calculation should be
if(valuelist('<00:01:00','00:01:00-01:00:00','>01:00:00')='<00:01:00',Sum( {$<time={"<=00:01:00"}>} value),
if(valuelist('<00:01:00','00:01:00-01:00:00','00:01:00-01:00:00')='<00:01:00',Sum( {$<time={">00:01:00<=01:00:00"}>} value),
Sum( {$<time={">01:00:00"}>} value)
))
Your sorting formula is
Match(valuelist('<00:01:00','00:01:00-01:00:00','>01:00:00'),'<00:01:00','00:01:00-01:00:00','>01:00:00')
With my testdata I get this bar chart
You can also make it a little bit more dynamic by defining your range limits as variables
To illustrate I defined
vRange1 = 00:00:10
vRange2 = 00:01:00
vRange3 = 01:00:00
This gives us 4 ranges, <Range1, Range1-Range2, Range2-Range3 and >Range3
Define a variable vTimerange as valuelist('<=$(vRange1)','$(vRange1)-$(vRange2)','$(vRange2)-$(vRange3)','>$(vRange3)')
Then I use $(vTimerange) as dimension and this calculation
if($(vTimerange)='<=$(vRange1)', Sum( {$<time={"<=$(vRange1)"}>} value),
if($(vTimerange)='$(vRange1)-$(vRange2)', Sum( {$<time={">$(vRange1)<=$(vRange2)"}>} value),
if($(vTimerange)='$(vRange2)-$(vRange3)', Sum( {$<time={">$(vRange2)<=$(vRange3)"}>} value),
Sum( {$<time={">$(vRange3)"}>} value)
)))
Below you see the outcome and what happens if I change my vRange variable input to 00:00:05
I understand you probably don't want your users to change ranges, but it's a good idea to use variables anyways as it gets very messy otherwise when adding more and more intervals.
Hope this gets you in the right direction.
(Probably some errors with </<= in my calculations, be more careful than I was)


