Unlock a world of possibilities! Login now and discover the exclusive benefits awaiting you.
- Qlik Community
- :
- Forums
- :
- Analytics
- :
- New to Qlik Analytics
- :
- Accumulating Counts in Line Chart
- Subscribe to RSS Feed
- Mark Topic as New
- Mark Topic as Read
- Float this Topic for Current User
- Bookmark
- Subscribe
- Mute
- Printer Friendly Page
- Mark as New
- Bookmark
- Subscribe
- Mute
- Subscribe to RSS Feed
- Permalink
- Report Inappropriate Content
Accumulating Counts in Line Chart
Hello Qlik Community,
New to Qlik Sense here (first post) and would greatly appreciate some help.
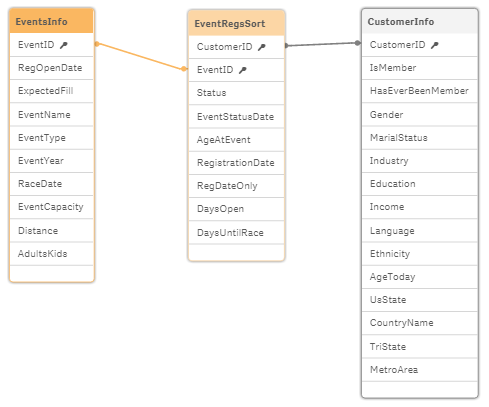
I'm trying to create a line graph which accumulates the count of event registrations based on the number of days since registration opened and is responsive to user filtering. Below is my current data model. 'EventsInfo' is a table of the events with details on the event, and 'EventRegsSort' is a table of individual customer registrations corresponding to each event.
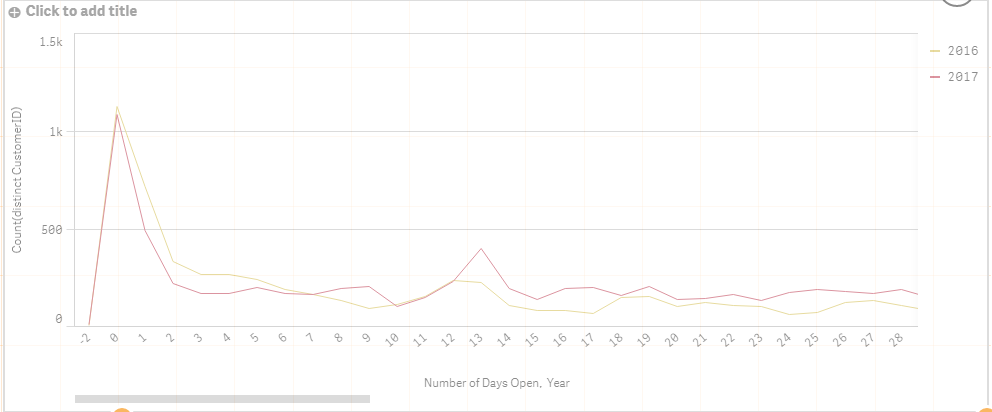
So far I have created the following graph depicting the numbers of registrations on a certain day since registration opened by simply adding 'DaysOpen' and EventYear' as dimensions and counting 'CustomerID' as the measure. The graph below as been filtered down to two years of data for one event using a filter pane.
Count(distinct CustomerID)
What I'm now trying to do is calculate and display the total number of registrations per day after registration opening, which would be calculated by the previous day's registration count plus the current day's registration count. I tried to do this using the following expression which resulted in the graph below.
RangeSum(Above(Count(distinct(CustomerID)),0,RowNo()))
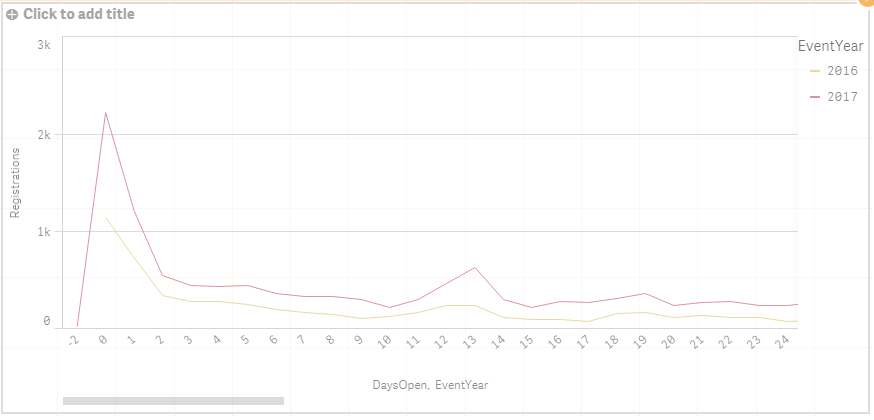
It looks like what's happening is the number of registrations on day X for 2016 is being added to the number of registrations on day X for 2017, and the line for 2017 is then displaying that value for day X, summarized below.
| Year | Day | Number of Registrations |
|---|---|---|
| 2016 | 0 | 1120 |
| 2017 | 0 | 1080 |
| 2017 | 0 | 2200 |
| 2016 | 1 | 710 |
| 2017 | 1 | 484 |
| 2017 | 1 | 1194 |
Whereas the result I'm trying to get would be the figures above for day 0 for 2016 and 2017, and then for day 1 would be those number plus the numbers for day 1 as such:
| Year | Day | Number of Reigstrations |
|---|---|---|
| 2016 | 0 | 1120 |
| 2017 | 0 | 1080 |
| 2016 | 1 | 1120 + 710 = 1830 |
| 2017 | 1 | 1080 + 484 = 1564 |
and so on for the remainder of the days.
I've also tried the following thinking that the registration totals for each day needed to be calculated and sorted, but the result was the same as the graph shown above:
RangeSum(Above(Aggr(Count(distinct CustomerID), EventYear, DaysOpen, (EventYear, (DaysOpen, (NUMERIC, ASCENDING)))), 0, RowNo()))
Also, I was able to get this to work in a straight table using the first expression above (shown below), but can't seem to get it to work with the line chart which makes me think it may be some kind of sorting issue, but I'm not sure how to address it (or if this is even the case).
RangeSum(Above(Count(distinct(CustomerID)),0,RowNo()))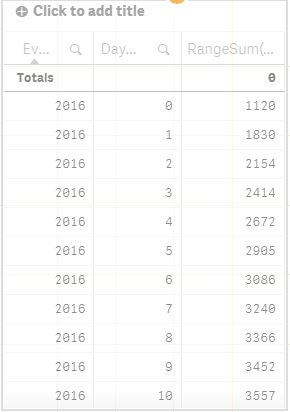
Again, any help would be greatly appreciated. Sorry for the long winded question if this is an easy fix, but it's had me stumped all day and none of the various accumulation related questions/answers I've found have worked.
Thanks,
Ford
Accepted Solutions
- Mark as New
- Bookmark
- Subscribe
- Mute
- Subscribe to RSS Feed
- Permalink
- Report Inappropriate Content
Try this
Aggr(RangeSum(Above(Count(DISTINCT CustomerID), 0, RowNo())) , Year, (DaysOpen, (Numeric)))
- Mark as New
- Bookmark
- Subscribe
- Mute
- Subscribe to RSS Feed
- Permalink
- Report Inappropriate Content
Try this
Aggr(RangeSum(Above(Count(DISTINCT CustomerID), 0, RowNo())) , Year, (DaysOpen, (Numeric)))
- Mark as New
- Bookmark
- Subscribe
- Mute
- Subscribe to RSS Feed
- Permalink
- Report Inappropriate Content
Ah I was so close! Thanks so much Sunny this works perfectly!
I'll note for any future readers that 'Year' in your expression needs to be changed to 'EventYear' in my case since just including 'Year' will call the 'Year()' function.
For my personal information, could you provide a brief explanation to why this works as opposed to the expression I tried above that contained 'Aggr()'?
- Mark as New
- Bookmark
- Subscribe
- Mute
- Subscribe to RSS Feed
- Permalink
- Report Inappropriate Content
There were couple of issues
RangeSum(Above(Aggr(Count(distinct CustomerID), EventYear, DaysOpen, (EventYear, (DaysOpen, (NUMERIC, ASCENDING)))), 0, RowNo()))
You are aggregating over EventYear and DaysOpen twice... you don't need that... and honestly since your first DaysOpen isn't sorted in ascending order it will be sorted in the sort order, which is not what you want... So we come to this:
RangeSum(Above(Aggr(Count(distinct CustomerID), EventYear, (DaysOpen, (NUMERIC, ASCENDING))), 0, RowNo()))
Now, the only reason to use Aggr() was to make sure that accumulation is done in a certain order... but since the RangeSum(Above()) is outside of Aggr() it is not even benefiting from the Aggr's sorting. In order to benefit from it, RangeSum(Above()) needs to be inside Aggr()
Aggr(RangeSum(Above(Count(DISTINCT CustomerID), 0, RowNo())) , Year, (DaysOpen, (Numeric)))
Does this make sense?
- Mark as New
- Bookmark
- Subscribe
- Mute
- Subscribe to RSS Feed
- Permalink
- Report Inappropriate Content
Makes perfect sense, thank you!