Unlock a world of possibilities! Login now and discover the exclusive benefits awaiting you.
- Qlik Community
- :
- Forums
- :
- Analytics
- :
- New to Qlik Analytics
- :
- Bar chart with conditionnal reference line
- Subscribe to RSS Feed
- Mark Topic as New
- Mark Topic as Read
- Float this Topic for Current User
- Bookmark
- Subscribe
- Mute
- Printer Friendly Page
- Mark as New
- Bookmark
- Subscribe
- Mute
- Subscribe to RSS Feed
- Permalink
- Report Inappropriate Content
Bar chart with conditionnal reference line
Hello,
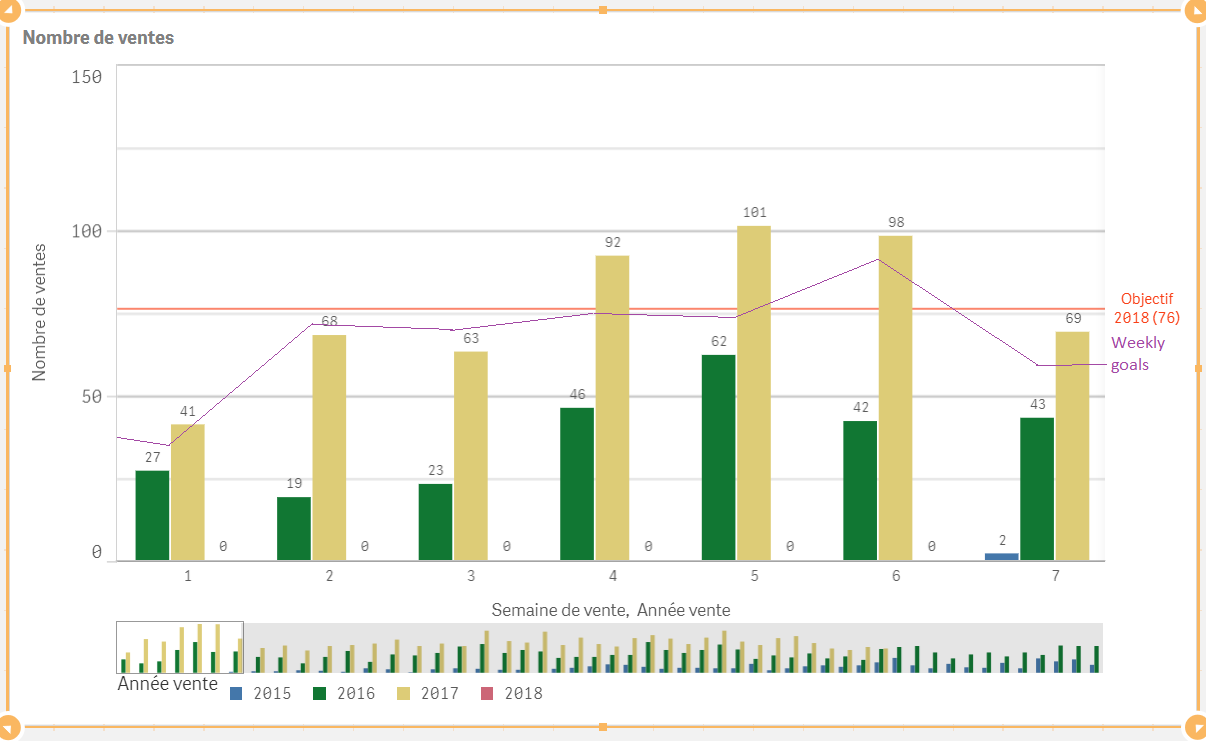
I have a bar chart with Year and Weeks as dimentions (weeks first) and number of sells as measure and i wanted to know if it was possible to have a reference "line" to show each week's sells objectives.
A combo chart can do it with a second measure but i lose the second dimension of the bar chart, and i don't want that.
Thanks !
----------
Bonjour,
J'ai un graphique en barres avec comme dimensions années et semaines (les semaines en premier) et le nombre de ventes comme mesure. J'aimerais savoir si c'était possible d'ajouter une ligne de référence qui montre les objectifs de vente de chaque semaine.
Dans le graphique combiné la seconde mesure permet de faire ça mais je perdrais du coup la dimension année du graph en barres et il doit rester.
Merci d'avance !
- Mark as New
- Bookmark
- Subscribe
- Mute
- Subscribe to RSS Feed
- Permalink
- Report Inappropriate Content
Yes add another Mesure for a reference line and change it from bar to line
- Mark as New
- Bookmark
- Subscribe
- Mute
- Subscribe to RSS Feed
- Permalink
- Report Inappropriate Content
and replace your dimensions Year and Month by one dimension Year-Month...otherwise, indeed, not something psosible in the standard objects of Qlik Sense.
- Mark as New
- Bookmark
- Subscribe
- Mute
- Subscribe to RSS Feed
- Permalink
- Report Inappropriate Content
Hi Gus - you are correct - the reference line add-on fx expression - can be used to create a calculated, dynamic value to create a dynamic line as per the conditions defined in the expression. If you want to use a line as an actual trend line, you must use that formula you showed, as an expression in another measure.
I assume you got that example from here How to add lineal trend in Qlik sense or here: Re: How to add lineal trend in Qlik sense
Let me know if you have any other questions.
Please mark the appropriate replies as CORRECT / HELPFUL so our team and other members know that your question(s) has been answered to your satisfaction.
Regards,
Mike Tarallo
Qlik
- Mark as New
- Bookmark
- Subscribe
- Mute
- Subscribe to RSS Feed
- Permalink
- Report Inappropriate Content
OK, thanks.
I don't think i can merge the 2 dimensions, it will not be clear enough. With 52 weeks each year, the chart would be too long.
Do you know of an extension that would do the trick?
- Mark as New
- Bookmark
- Subscribe
- Mute
- Subscribe to RSS Feed
- Permalink
- Report Inappropriate Content
Hello guys,
I can't use your suggestions of the reference line as a measure since i have a simple bar chart and not a combo chart. And the client want to keep his sorting by weeks and year.
Here is what i have right now :
The goal was to add a line which would show each week's goals that the client could change. Kinda like so :

It's not possible with standard QlikSense (thanks Mikael) so does any of you know an extension that would do the trick?